Some Centrepoint Alliance (ASX:CAF) Shareholders Have Taken A Painful 82% Share Price Drop

Every investor on earth makes bad calls sometimes. But you want to avoid the really big losses like the plague. So consider, for a moment, the misfortune of Centrepoint Alliance Limited (ASX:CAF) investors who have held the stock for three years as it declined a whopping 82%. That'd be enough to cause even the strongest minds some disquiet.
We really feel for shareholders in this scenario. It's a good reminder of the importance of diversification, and it's worth keeping in mind there's more to life than money, anyway.
Check out our latest analysis for Centrepoint Alliance
Centrepoint Alliance wasn't profitable in the last twelve months, it is unlikely we'll see a strong correlation between its share price and its earnings per share (EPS). Arguably revenue is our next best option. Shareholders of unprofitable companies usually expect strong revenue growth. That's because it's hard to be confident a company will be sustainable if revenue growth is negligible, and it never makes a profit.
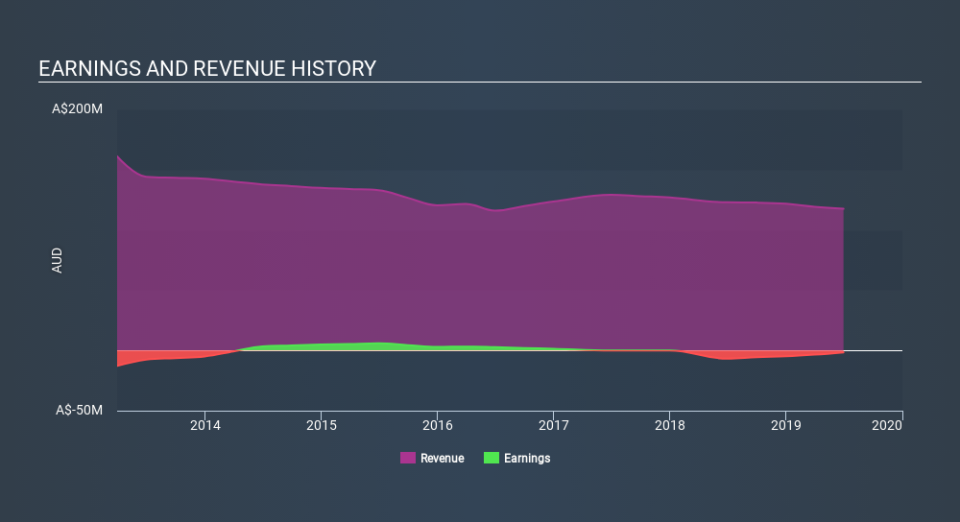
Over the last three years, Centrepoint Alliance's revenue dropped 0.4% per year. That is not a good result. The share price fall of 44% (per year, over three years) is a stern reminder that money-losing companies are expected to grow revenue. We're generally averse to companies with declining revenues, but we're not alone in that. Don't let a share price decline ruin your calm. You make better decisions when you're calm.
The graphic below depicts how earnings and revenue have changed over time (unveil the exact values by clicking on the image).
We like that insiders have been buying shares in the last twelve months. Having said that, most people consider earnings and revenue growth trends to be a more meaningful guide to the business. Dive deeper into the earnings by checking this interactive graph of Centrepoint Alliance's earnings, revenue and cash flow.
What about the Total Shareholder Return (TSR)?
We've already covered Centrepoint Alliance's share price action, but we should also mention its total shareholder return (TSR). Arguably the TSR is a more complete return calculation because it accounts for the value of dividends (as if they were reinvested), along with the hypothetical value of any discounted capital that have been offered to shareholders. Dividends have been really beneficial for Centrepoint Alliance shareholders, and that cash payout explains why its total shareholder loss of 79%, over the last 3 years, isn't as bad as the share price return.
A Different Perspective
We're pleased to report that Centrepoint Alliance shareholders have received a total shareholder return of 33% over one year. Notably the five-year annualised TSR loss of 18% per year compares very unfavourably with the recent share price performance. We generally put more weight on the long term performance over the short term, but the recent improvement could hint at a (positive) inflection point within the business. It's always interesting to track share price performance over the longer term. But to understand Centrepoint Alliance better, we need to consider many other factors. Like risks, for instance. Every company has them, and we've spotted 3 warning signs for Centrepoint Alliance (of which 1 can't be ignored!) you should know about.
Centrepoint Alliance is not the only stock that insiders are buying. For those who like to find winning investments this free list of growing companies with recent insider purchasing, could be just the ticket.
Please note, the market returns quoted in this article reflect the market weighted average returns of stocks that currently trade on AU exchanges.
If you spot an error that warrants correction, please contact the editor at editorial-team@simplywallst.com. This article by Simply Wall St is general in nature. It does not constitute a recommendation to buy or sell any stock, and does not take account of your objectives, or your financial situation. Simply Wall St has no position in the stocks mentioned.
We aim to bring you long-term focused research analysis driven by fundamental data. Note that our analysis may not factor in the latest price-sensitive company announcements or qualitative material. Thank you for reading.
