Is New Century Healthcare Holding Co. Limited’s (HKG:1518) High P/E Ratio A Problem For Investors?

Want to participate in a short research study? Help shape the future of investing tools and receive a $20 prize!
This article is written for those who want to get better at using price to earnings ratios (P/E ratios). We’ll show how you can use New Century Healthcare Holding Co. Limited’s (HKG:1518) P/E ratio to inform your assessment of the investment opportunity. New Century Healthcare Holding has a price to earnings ratio of 48.98, based on the last twelve months. That corresponds to an earnings yield of approximately 2.0%.
View our latest analysis for New Century Healthcare Holding
How Do You Calculate A P/E Ratio?
The formula for price to earnings is:
Price to Earnings Ratio = Share Price (in reporting currency) ÷ Earnings per Share (EPS)
Or for New Century Healthcare Holding:
P/E of 48.98 = CN¥5.25 (Note: this is the share price in the reporting currency, namely, CNY ) ÷ CN¥0.11 (Based on the year to June 2018.)
Is A High Price-to-Earnings Ratio Good?
A higher P/E ratio means that investors are paying a higher price for each HK$1 of company earnings. That isn’t necessarily good or bad, but a high P/E implies relatively high expectations of what a company can achieve in the future.
How Growth Rates Impact P/E Ratios
Probably the most important factor in determining what P/E a company trades on is the earnings growth. When earnings grow, the ‘E’ increases, over time. That means even if the current P/E is high, it will reduce over time if the share price stays flat. Then, a lower P/E should attract more buyers, pushing the share price up.
New Century Healthcare Holding’s earnings per share fell by 69% in the last twelve months. But EPS is up 3.9% over the last 5 years.
How Does New Century Healthcare Holding’s P/E Ratio Compare To Its Peers?
The P/E ratio indicates whether the market has higher or lower expectations of a company. You can see in the image below that the average P/E (23.2) for companies in the healthcare industry is lower than New Century Healthcare Holding’s P/E.
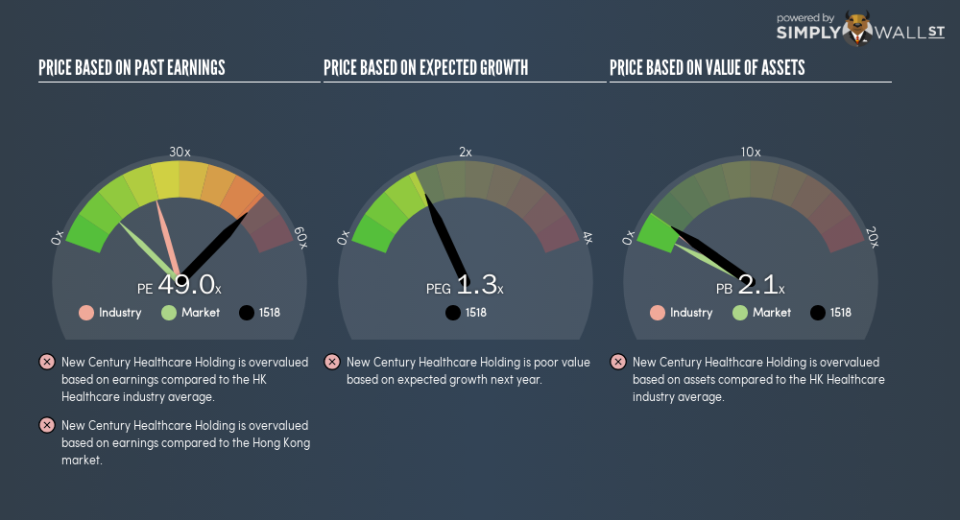
Its relatively high P/E ratio indicates that New Century Healthcare Holding shareholders think it will perform better than other companies in its industry classification. Clearly the market expects growth, but it isn’t guaranteed. So further research is always essential. I often monitor director buying and selling.
A Limitation: P/E Ratios Ignore Debt and Cash In The Bank
The ‘Price’ in P/E reflects the market capitalization of the company. That means it doesn’t take debt or cash into account. In theory, a company can lower its future P/E ratio by using cash or debt to invest in growth.
Spending on growth might be good or bad a few years later, but the point is that the P/E ratio does not account for the option (or lack thereof).
Is Debt Impacting New Century Healthcare Holding’s P/E?
Since New Century Healthcare Holding holds net cash of CN¥881m, it can spend on growth, justifying a higher P/E ratio than otherwise.
The Verdict On New Century Healthcare Holding’s P/E Ratio
New Century Healthcare Holding has a P/E of 49. That’s significantly higher than the average in the HK market, which is 10.7. The recent drop in earnings per share might keep value investors away, but the net cash position means the company has time to improve: and the high P/E suggests the market thinks it will.
When the market is wrong about a stock, it gives savvy investors an opportunity. People often underestimate remarkable growth — so investors can make money when fast growth is not fully appreciated. So this free report on the analyst consensus forecasts could help you make a master move on this stock.
But note: New Century Healthcare Holding may not be the best stock to buy. So take a peek at this free list of interesting companies with strong recent earnings growth (and a P/E ratio below 20).
We aim to bring you long-term focused research analysis driven by fundamental data. Note that our analysis may not factor in the latest price-sensitive company announcements or qualitative material.
If you spot an error that warrants correction, please contact the editor at editorial-team@simplywallst.com. This article by Simply Wall St is general in nature. It does not constitute a recommendation to buy or sell any stock, and does not take account of your objectives, or your financial situation. Simply Wall St has no position in the stocks mentioned. Thank you for reading.

