What Is Century Textiles and Industries's (NSE:CENTURYTEX) P/E Ratio After Its Share Price Tanked?

Unfortunately for some shareholders, the Century Textiles and Industries (NSE:CENTURYTEX) share price has dived 55% in the last thirty days. Indeed the recent decline has arguably caused some bitterness for shareholders who have held through the 52% drop over twelve months.
Assuming nothing else has changed, a lower share price makes a stock more attractive to potential buyers. In the long term, share prices tend to follow earnings per share, but in the short term prices bounce around in response to short term factors (which are not always obvious). So, on certain occasions, long term focussed investors try to take advantage of pessimistic expectations to buy shares at a better price. One way to gauge market expectations of a stock is to look at its Price to Earnings Ratio (PE Ratio). A high P/E ratio means that investors have a high expectation about future growth, while a low P/E ratio means they have low expectations about future growth.
Check out our latest analysis for Century Textiles and Industries
Does Century Textiles and Industries Have A Relatively High Or Low P/E For Its Industry?
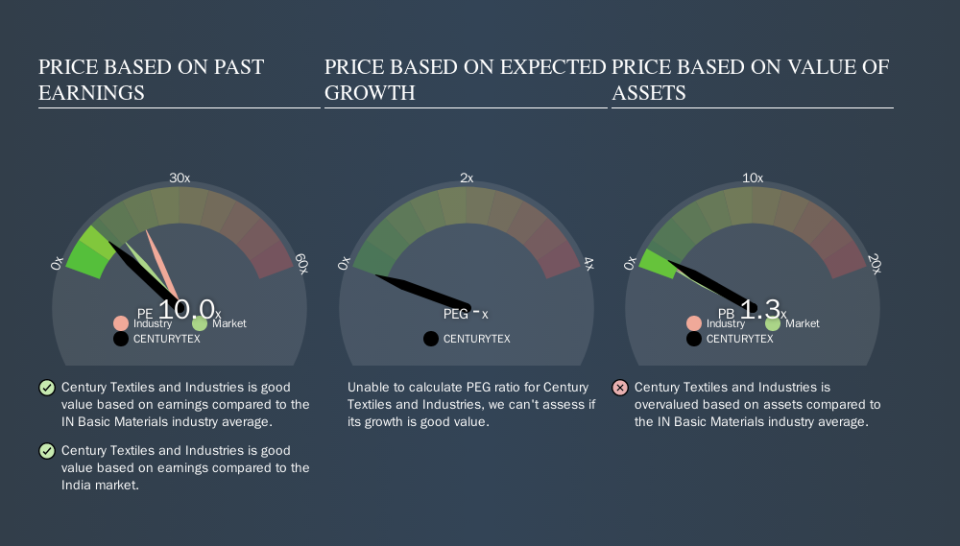
Century Textiles and Industries's P/E of 9.97 indicates relatively low sentiment towards the stock. The image below shows that Century Textiles and Industries has a lower P/E than the average (20.1) P/E for companies in the basic materials industry.
This suggests that market participants think Century Textiles and Industries will underperform other companies in its industry. Many investors like to buy stocks when the market is pessimistic about their prospects. If you consider the stock interesting, further research is recommended. For example, I often monitor director buying and selling.
How Growth Rates Impact P/E Ratios
Probably the most important factor in determining what P/E a company trades on is the earnings growth. That's because companies that grow earnings per share quickly will rapidly increase the 'E' in the equation. That means even if the current P/E is high, it will reduce over time if the share price stays flat. A lower P/E should indicate the stock is cheap relative to others -- and that may attract buyers.
Century Textiles and Industries's earnings made like a rocket, taking off 57% last year. The cherry on top is that the five year growth rate was an impressive 63% per year. With that kind of growth rate we would generally expect a high P/E ratio.
Don't Forget: The P/E Does Not Account For Debt or Bank Deposits
One drawback of using a P/E ratio is that it considers market capitalization, but not the balance sheet. Thus, the metric does not reflect cash or debt held by the company. The exact same company would hypothetically deserve a higher P/E ratio if it had a strong balance sheet, than if it had a weak one with lots of debt, because a cashed up company can spend on growth.
Such spending might be good or bad, overall, but the key point here is that you need to look at debt to understand the P/E ratio in context.
Is Debt Impacting Century Textiles and Industries's P/E?
Century Textiles and Industries has net debt worth just 5.1% of its market capitalization. It would probably trade on a higher P/E ratio if it had a lot of cash, but I doubt it is having a big impact.
The Bottom Line On Century Textiles and Industries's P/E Ratio
Century Textiles and Industries trades on a P/E ratio of 10.0, which is below the IN market average of 13.1. The EPS growth last year was strong, and debt levels are quite reasonable. The low P/E ratio suggests current market expectations are muted, implying these levels of growth will not continue. Given Century Textiles and Industries's P/E ratio has declined from 22.3 to 10.0 in the last month, we know for sure that the market is more worried about the business today, than it was back then. For those who prefer invest in growth, this stock apparently offers limited promise, but the deep value investors may find the pessimism around this stock enticing.
Investors should be looking to buy stocks that the market is wrong about. If it is underestimating a company, investors can make money by buying and holding the shares until the market corrects itself. So this free visual report on analyst forecasts could hold the key to an excellent investment decision.
Of course, you might find a fantastic investment by looking at a few good candidates. So take a peek at this free list of companies with modest (or no) debt, trading on a P/E below 20.
We aim to bring you long-term focused research analysis driven by fundamental data. Note that our analysis may not factor in the latest price-sensitive company announcements or qualitative material.
If you spot an error that warrants correction, please contact the editor at editorial-team@simplywallst.com. This article by Simply Wall St is general in nature. It does not constitute a recommendation to buy or sell any stock, and does not take account of your objectives, or your financial situation. Simply Wall St has no position in the stocks mentioned. Thank you for reading.
