Has ChemoMetec A/S' (CPH:CHEMM) Impressive Stock Performance Got Anything to Do With Its Fundamentals?

ChemoMetec's's (CPH:CHEMM) stock is up by a considerable 31% over the past three months. Given that stock prices are usually aligned with a company's financial performance in the long-term, we decided to study its financial indicators more closely to see if they had a hand to play in the recent price move. In this article, we decided to focus on ChemoMetec's ROE.
ROE or return on equity is a useful tool to assess how effectively a company can generate returns on the investment it received from its shareholders. Put another way, it reveals the company's success at turning shareholder investments into profits.
See our latest analysis for ChemoMetec
How To Calculate Return On Equity?
The formula for ROE is:
Return on Equity = Net Profit (from continuing operations) ÷ Shareholders' Equity
So, based on the above formula, the ROE for ChemoMetec is:
12% = ø48m ÷ ø397m (Based on the trailing twelve months to December 2019).
The 'return' is the profit over the last twelve months. That means that for every DKK1 worth of shareholders' equity, the company generated DKK0.12 in profit.
What Has ROE Got To Do With Earnings Growth?
Thus far, we have learnt that ROE measures how efficiently a company is generating its profits. We now need to evaluate how much profit the company reinvests or "retains" for future growth which then gives us an idea about the growth potential of the company. Assuming all else is equal, companies that have both a higher return on equity and higher profit retention are usually the ones that have a higher growth rate when compared to companies that don't have the same features.
A Side By Side comparison of ChemoMetec's Earnings Growth And 12% ROE
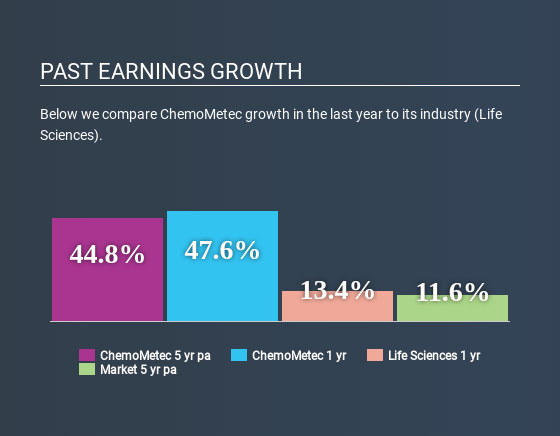
To start with, ChemoMetec's ROE looks acceptable. Further, the company's ROE is similar to the industry average of 11%. This certainly adds some context to ChemoMetec's exceptional 45% net income growth seen over the past five years. We believe that there might also be other aspects that are positively influencing the company's earnings growth. Such as - high earnings retention or an efficient management in place.
Next, on comparing with the industry net income growth, we found that ChemoMetec's growth is quite high when compared to the industry average growth of 15% in the same period, which is great to see.
Earnings growth is an important metric to consider when valuing a stock. The investor should try to establish if the expected growth or decline in earnings, whichever the case may be, is priced in. Doing so will help them establish if the stock's future looks promising or ominous. If you're wondering about ChemoMetec's's valuation, check out this gauge of its price-to-earnings ratio, as compared to its industry.
Is ChemoMetec Efficiently Re-investing Its Profits?
ChemoMetec has very a high three-year median payout ratio of 106% suggesting that the company's shareholders are getting paid from more than just the company's earnings. Despite this, the company's earnings grew significantly as we saw above. Having said that, the high payout ratio is definitely risky and something to keep an eye on. Our risks dashboard should have the 2 risks we have identified for ChemoMetec.
While ChemoMetec has been growing its earnings, it only recently started to pay dividends which likely means that the company decided to impress new and existing shareholders with a dividend.
Conclusion
In total, it does look like ChemoMetec has some positive aspects to its business. Namely, its high earnings growth, which was likely due to its high ROE. However, investors could have benefitted even more from the high ROE, had the company been reinvesting more of its earnings. As discussed earlier, the company is retaining hardly any of its profits. So far, we've only made a quick discussion around the company's earnings growth. So it may be worth checking this free detailed graph of ChemoMetec's past earnings, as well as revenue and cash flows to get a deeper insight into the company's performance.
Love or hate this article? Concerned about the content? Get in touch with us directly. Alternatively, email editorial-team@simplywallst.com.
This article by Simply Wall St is general in nature. It does not constitute a recommendation to buy or sell any stock, and does not take account of your objectives, or your financial situation. We aim to bring you long-term focused analysis driven by fundamental data. Note that our analysis may not factor in the latest price-sensitive company announcements or qualitative material. Simply Wall St has no position in any stocks mentioned. Thank you for reading.
