Is Chen Hsong Holdings Limited's (HKG:57) High P/E Ratio A Problem For Investors?

This article is written for those who want to get better at using price to earnings ratios (P/E ratios). We'll show how you can use Chen Hsong Holdings Limited's (HKG:57) P/E ratio to inform your assessment of the investment opportunity. What is Chen Hsong Holdings's P/E ratio? Well, based on the last twelve months it is 33.46. In other words, at today's prices, investors are paying HK$33.46 for every HK$1 in prior year profit.
Check out our latest analysis for Chen Hsong Holdings
How Do I Calculate A Price To Earnings Ratio?
The formula for P/E is:
Price to Earnings Ratio = Price per Share ÷ Earnings per Share (EPS)
Or for Chen Hsong Holdings:
P/E of 33.46 = HK$2.97 ÷ HK$0.089 (Based on the trailing twelve months to September 2018.)
Is A High Price-to-Earnings Ratio Good?
The higher the P/E ratio, the higher the price tag of a business, relative to its trailing earnings. That is not a good or a bad thing per se, but a high P/E does imply buyers are optimistic about the future.
How Growth Rates Impact P/E Ratios
Probably the most important factor in determining what P/E a company trades on is the earnings growth. Earnings growth means that in the future the 'E' will be higher. That means even if the current P/E is high, it will reduce over time if the share price stays flat. And as that P/E ratio drops, the company will look cheap, unless its share price increases.
Chen Hsong Holdings's earnings per share fell by 42% in the last twelve months. And it has shrunk its earnings per share by 13% per year over the last five years. This could justify a pessimistic P/E.
Does Chen Hsong Holdings Have A Relatively High Or Low P/E For Its Industry?
The P/E ratio essentially measures market expectations of a company. The image below shows that Chen Hsong Holdings has a significantly higher P/E than the average (10.2) P/E for companies in the machinery industry.
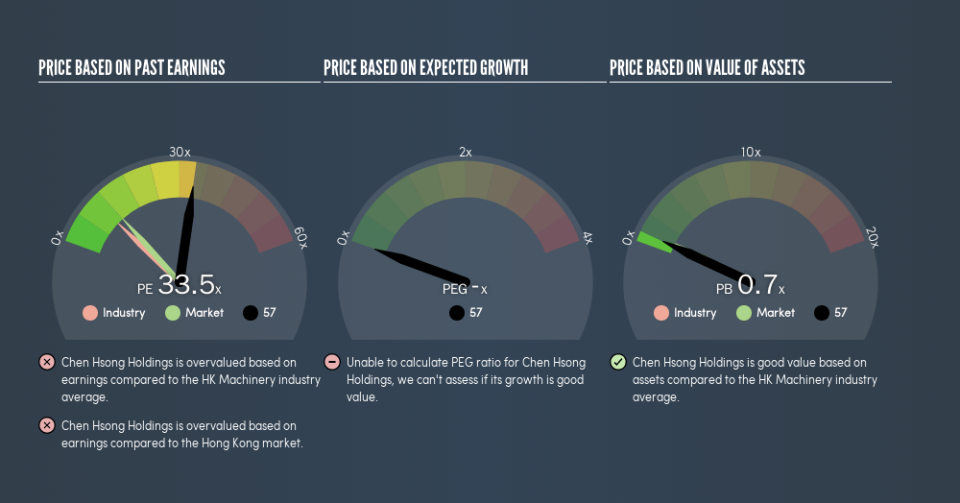
That means that the market expects Chen Hsong Holdings will outperform other companies in its industry. The market is optimistic about the future, but that doesn't guarantee future growth. So investors should delve deeper. I like to check if company insiders have been buying or selling.
A Limitation: P/E Ratios Ignore Debt and Cash In The Bank
Don't forget that the P/E ratio considers market capitalization. So it won't reflect the advantage of cash, or disadvantage of debt. Hypothetically, a company could reduce its future P/E ratio by spending its cash (or taking on debt) to achieve higher earnings.
While growth expenditure doesn't always pay off, the point is that it is a good option to have; but one that the P/E ratio ignores.
So What Does Chen Hsong Holdings's Balance Sheet Tell Us?
With net cash of HK$509m, Chen Hsong Holdings has a very strong balance sheet, which may be important for its business. Having said that, at 29% of its market capitalization the cash hoard would contribute towards a higher P/E ratio.
The Verdict On Chen Hsong Holdings's P/E Ratio
Chen Hsong Holdings trades on a P/E ratio of 33.5, which is above the HK market average of 12.1. The recent drop in earnings per share would make some investors cautious, but the relatively strong balance sheet will allow the company time to invest in growth. Clearly, the high P/E indicates shareholders think it will!
When the market is wrong about a stock, it gives savvy investors an opportunity. As value investor Benjamin Graham famously said, 'In the short run, the market is a voting machine but in the long run, it is a weighing machine.' Although we don't have analyst forecasts, you might want to assess this data-rich visualization of earnings, revenue and cash flow.
You might be able to find a better buy than Chen Hsong Holdings. If you want a selection of possible winners, check out this free list of interesting companies that trade on a P/E below 20 (but have proven they can grow earnings).
We aim to bring you long-term focused research analysis driven by fundamental data. Note that our analysis may not factor in the latest price-sensitive company announcements or qualitative material.
If you spot an error that warrants correction, please contact the editor at editorial-team@simplywallst.com. This article by Simply Wall St is general in nature. It does not constitute a recommendation to buy or sell any stock, and does not take account of your objectives, or your financial situation. Simply Wall St has no position in the stocks mentioned. Thank you for reading.

