Is Chengdu Expressway Co., Ltd.'s (HKG:1785) High P/E Ratio A Problem For Investors?

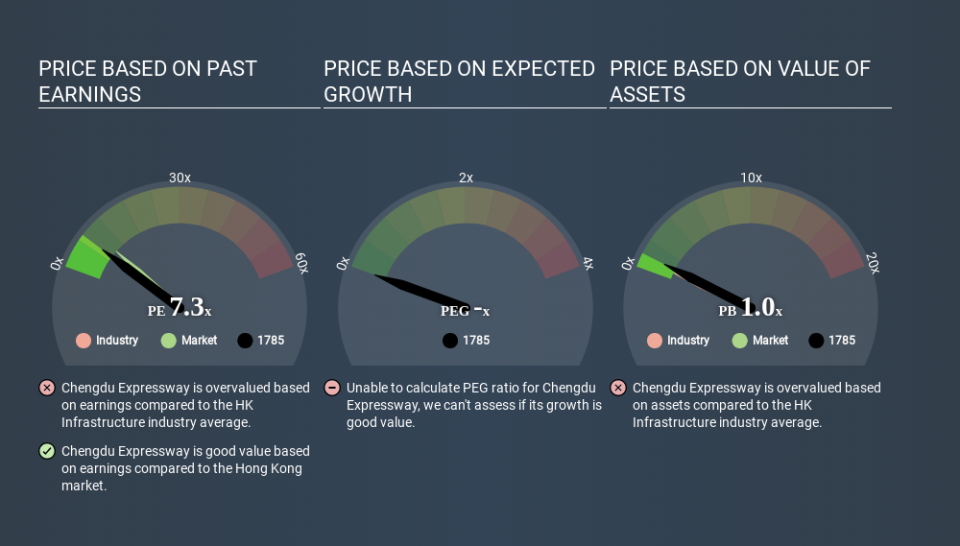
This article is written for those who want to get better at using price to earnings ratios (P/E ratios). We'll apply a basic P/E ratio analysis to Chengdu Expressway Co., Ltd.'s (HKG:1785), to help you decide if the stock is worth further research. Looking at earnings over the last twelve months, Chengdu Expressway has a P/E ratio of 7.34. That means that at current prices, buyers pay HK$7.34 for every HK$1 in trailing yearly profits.
See our latest analysis for Chengdu Expressway
How Do I Calculate A Price To Earnings Ratio?
The formula for price to earnings is:
Price to Earnings Ratio = Price per Share (in the reporting currency) ÷ Earnings per Share (EPS)
Or for Chengdu Expressway:
P/E of 7.34 = CN¥1.965 ÷ CN¥0.268 (Based on the trailing twelve months to December 2019.)
(Note: the above calculation uses the share price in the reporting currency, namely CNY and the calculation results may not be precise due to rounding.)
Is A High Price-to-Earnings Ratio Good?
The higher the P/E ratio, the higher the price tag of a business, relative to its trailing earnings. That isn't a good or a bad thing on its own, but a high P/E means that buyers have a higher opinion of the business's prospects, relative to stocks with a lower P/E.
Does Chengdu Expressway Have A Relatively High Or Low P/E For Its Industry?
The P/E ratio essentially measures market expectations of a company. You can see in the image below that the average P/E (6.8) for companies in the infrastructure industry is roughly the same as Chengdu Expressway's P/E.
Its P/E ratio suggests that Chengdu Expressway shareholders think that in the future it will perform about the same as other companies in its industry classification. If the company has better than average prospects, then the market might be underestimating it. Further research into factors such as insider buying and selling, could help you form your own view on whether that is likely.
How Growth Rates Impact P/E Ratios
P/E ratios primarily reflect market expectations around earnings growth rates. When earnings grow, the 'E' increases, over time. Therefore, even if you pay a high multiple of earnings now, that multiple will become lower in the future. So while a stock may look expensive based on past earnings, it could be cheap based on future earnings.
Chengdu Expressway's earnings per share fell by 23% in the last twelve months. But EPS is up 5.6% over the last 5 years.
A Limitation: P/E Ratios Ignore Debt and Cash In The Bank
It's important to note that the P/E ratio considers the market capitalization, not the enterprise value. Thus, the metric does not reflect cash or debt held by the company. Theoretically, a business can improve its earnings (and produce a lower P/E in the future) by investing in growth. That means taking on debt (or spending its cash).
Such expenditure might be good or bad, in the long term, but the point here is that the balance sheet is not reflected by this ratio.
How Does Chengdu Expressway's Debt Impact Its P/E Ratio?
Chengdu Expressway's net debt equates to 47% of its market capitalization. You'd want to be aware of this fact, but it doesn't bother us.
The Verdict On Chengdu Expressway's P/E Ratio
Chengdu Expressway has a P/E of 7.3. That's below the average in the HK market, which is 9.4. With only modest debt, it's likely the lack of EPS growth at least partially explains the pessimism implied by the P/E ratio.
Investors should be looking to buy stocks that the market is wrong about. If the reality for a company is not as bad as the P/E ratio indicates, then the share price should increase as the market realizes this. Although we don't have analyst forecasts you could get a better understanding of its growth by checking out this more detailed historical graph of earnings, revenue and cash flow.
Of course, you might find a fantastic investment by looking at a few good candidates. So take a peek at this free list of companies with modest (or no) debt, trading on a P/E below 20.
If you spot an error that warrants correction, please contact the editor at editorial-team@simplywallst.com. This article by Simply Wall St is general in nature. It does not constitute a recommendation to buy or sell any stock, and does not take account of your objectives, or your financial situation. Simply Wall St has no position in the stocks mentioned.
We aim to bring you long-term focused research analysis driven by fundamental data. Note that our analysis may not factor in the latest price-sensitive company announcements or qualitative material. Thank you for reading.

