Is China Education Group Holdings Limited’s (HKG:839) High P/E Ratio A Problem For Investors?

Want to participate in a short research study? Help shape the future of investing tools and you could win a $250 gift card!
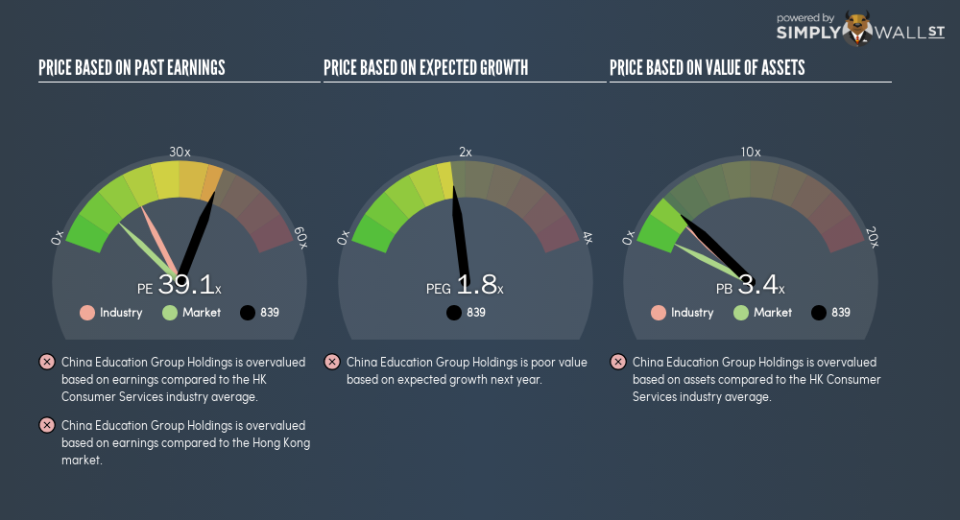
This article is for investors who would like to improve their understanding of price to earnings ratios (P/E ratios). We’ll show how you can use China Education Group Holdings Limited’s (HKG:839) P/E ratio to inform your assessment of the investment opportunity. China Education Group Holdings has a price to earnings ratio of 39.1, based on the last twelve months. That is equivalent to an earnings yield of about 2.6%.
View our latest analysis for China Education Group Holdings
How Do You Calculate China Education Group Holdings’s P/E Ratio?
The formula for P/E is:
Price to Earnings Ratio = Price per Share (in the reporting currency) ÷ Earnings per Share (EPS)
Or for China Education Group Holdings:
P/E of 39.1 = CN¥10.38 (Note: this is the share price in the reporting currency, namely, CNY ) ÷ CN¥0.27 (Based on the year to August 2018.)
Is A High Price-to-Earnings Ratio Good?
A higher P/E ratio means that buyers have to pay a higher price for each HK$1 the company has earned over the last year. That isn’t necessarily good or bad, but a high P/E implies relatively high expectations of what a company can achieve in the future.
How Growth Rates Impact P/E Ratios
P/E ratios primarily reflect market expectations around earnings growth rates. When earnings grow, the ‘E’ increases, over time. Therefore, even if you pay a high multiple of earnings now, that multiple will become lower in the future. Then, a lower P/E should attract more buyers, pushing the share price up.
China Education Group Holdings shrunk earnings per share by 1.5% last year. But EPS is up 8.4% over the last 5 years.
How Does China Education Group Holdings’s P/E Ratio Compare To Its Peers?
We can get an indication of market expectations by looking at the P/E ratio. As you can see below, China Education Group Holdings has a higher P/E than the average company (18.4) in the consumer services industry.
That means that the market expects China Education Group Holdings will outperform other companies in its industry. Shareholders are clearly optimistic, but the future is always uncertain. So further research is always essential. I often monitor director buying and selling.
A Limitation: P/E Ratios Ignore Debt and Cash In The Bank
The ‘Price’ in P/E reflects the market capitalization of the company. In other words, it does not consider any debt or cash that the company may have on the balance sheet. Theoretically, a business can improve its earnings (and produce a lower P/E in the future), by taking on debt (or spending its remaining cash).
Such spending might be good or bad, overall, but the key point here is that you need to look at debt to understand the P/E ratio in context.
How Does China Education Group Holdings’s Debt Impact Its P/E Ratio?
The extra options and safety that comes with China Education Group Holdings’s CN¥1.6b net cash position means that it deserves a higher P/E than it would if it had a lot of net debt.
The Bottom Line On China Education Group Holdings’s P/E Ratio
China Education Group Holdings has a P/E of 39.1. That’s significantly higher than the average in the HK market, which is 10.5. The recent drop in earnings per share might keep value investors away, but the relatively strong balance sheet will allow the company time to invest in growth. Clearly, the high P/E indicates shareholders think it will!
Investors should be looking to buy stocks that the market is wrong about. People often underestimate remarkable growth — so investors can make money when fast growth is not fully appreciated. So this free report on the analyst consensus forecasts could help you make a master move on this stock.
Of course you might be able to find a better stock than China Education Group Holdings. So you may wish to see this free collection of other companies that have grown earnings strongly.
To help readers see past the short term volatility of the financial market, we aim to bring you a long-term focused research analysis purely driven by fundamental data. Note that our analysis does not factor in the latest price-sensitive company announcements.
The author is an independent contributor and at the time of publication had no position in the stocks mentioned. For errors that warrant correction please contact the editor at editorial-team@simplywallst.com.
