Is China Longyuan Power Group Corporation Limited’s (HKG:916) 9.4% ROCE Any Good?

Want to participate in a short research study? Help shape the future of investing tools and receive a $20 prize!
Today we’ll look at China Longyuan Power Group Corporation Limited (HKG:916) and reflect on its potential as an investment. Specifically, we’re going to calculate its Return On Capital Employed (ROCE), in the hopes of getting some insight into the business.
First, we’ll go over how we calculate ROCE. Next, we’ll compare it to others in its industry. And finally, we’ll look at how its current liabilities are impacting its ROCE.
What is Return On Capital Employed (ROCE)?
ROCE is a metric for evaluating how much pre-tax income (in percentage terms) a company earns on the capital invested in its business. All else being equal, a better business will have a higher ROCE. In brief, it is a useful tool, but it is not without drawbacks. Renowned investment researcher Michael Mauboussin has suggested that a high ROCE can indicate that ‘one dollar invested in the company generates value of more than one dollar’.
So, How Do We Calculate ROCE?
The formula for calculating the return on capital employed is:
Return on Capital Employed = Earnings Before Interest and Tax (EBIT) ÷ (Total Assets – Current Liabilities)
Or for China Longyuan Power Group:
0.094 = CN¥8.4b ÷ (CN¥146b – CN¥41b) (Based on the trailing twelve months to September 2018.)
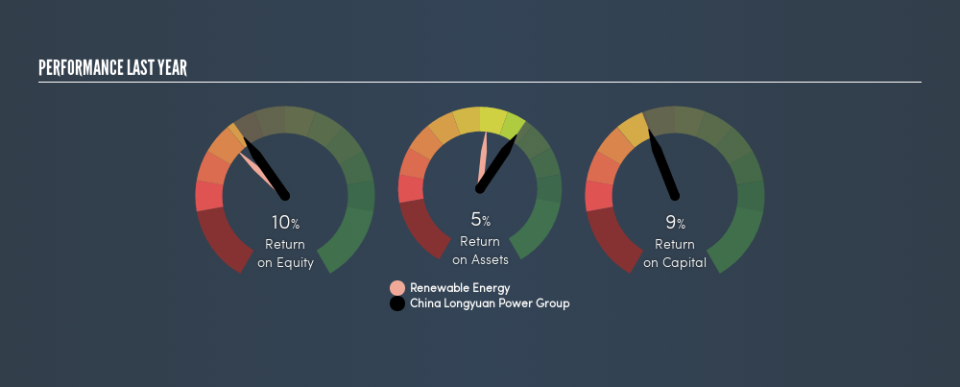
Therefore, China Longyuan Power Group has an ROCE of 9.4%.
Check out our latest analysis for China Longyuan Power Group
Does China Longyuan Power Group Have A Good ROCE?
One way to assess ROCE is to compare similar companies. In our analysis, China Longyuan Power Group’s ROCE is meaningfully higher than the 6.3% average in the Renewable Energy industry. We would consider this a positive, as it suggests it is using capital more effectively than other similar companies. Aside from the industry comparison, China Longyuan Power Group’s ROCE is mediocre in absolute terms, considering the risk of investing in stocks versus the safety of a bank account. Readers may find more attractive investment prospects elsewhere.
It is important to remember that ROCE shows past performance, and is not necessarily predictive. ROCE can be misleading for companies in cyclical industries, with returns looking impressive during the boom times, but very weak during the busts. ROCE is, after all, simply a snap shot of a single year. What happens in the future is pretty important for investors, so we have prepared a free report on analyst forecasts for China Longyuan Power Group.
Do China Longyuan Power Group’s Current Liabilities Skew Its ROCE?
Liabilities, such as supplier bills and bank overdrafts, are referred to as current liabilities if they need to be paid within 12 months. Due to the way ROCE is calculated, a high level of current liabilities makes a company look as though it has less capital employed, and thus can (sometimes unfairly) boost the ROCE. To counter this, investors can check if a company has high current liabilities relative to total assets.
China Longyuan Power Group has total assets of CN¥146b and current liabilities of CN¥41b. As a result, its current liabilities are equal to approximately 28% of its total assets. This very reasonable level of current liabilities would not boost the ROCE by much.
What We Can Learn From China Longyuan Power Group’s ROCE
With that in mind, we’re not overly impressed with China Longyuan Power Group’s ROCE, so it may not be the most appealing prospect. You might be able to find a better buy than China Longyuan Power Group. If you want a selection of possible winners, check out this free list of interesting companies that trade on a P/E below 20 (but have proven they can grow earnings).
If you like to buy stocks alongside management, then you might just love this free list of companies. (Hint: insiders have been buying them).
We aim to bring you long-term focused research analysis driven by fundamental data. Note that our analysis may not factor in the latest price-sensitive company announcements or qualitative material.
If you spot an error that warrants correction, please contact the editor at editorial-team@simplywallst.com. This article by Simply Wall St is general in nature. It does not constitute a recommendation to buy or sell any stock, and does not take account of your objectives, or your financial situation. Simply Wall St has no position in the stocks mentioned. Thank you for reading.

