What Can We Make Of China Nonferrous Mining Corporation Limited’s (HKG:1258) High Return On Capital?

Today we are going to look at China Nonferrous Mining Corporation Limited (HKG:1258) to see whether it might be an attractive investment prospect. Specifically, we'll consider its Return On Capital Employed (ROCE), since that will give us an insight into how efficiently the business can generate profits from the capital it requires.
Firstly, we'll go over how we calculate ROCE. Next, we'll compare it to others in its industry. And finally, we'll look at how its current liabilities are impacting its ROCE.
What is Return On Capital Employed (ROCE)?
ROCE is a measure of a company's yearly pre-tax profit (its return), relative to the capital employed in the business. Generally speaking a higher ROCE is better. In brief, it is a useful tool, but it is not without drawbacks. Author Edwin Whiting says to be careful when comparing the ROCE of different businesses, since 'No two businesses are exactly alike.
How Do You Calculate Return On Capital Employed?
Analysts use this formula to calculate return on capital employed:
Return on Capital Employed = Earnings Before Interest and Tax (EBIT) ÷ (Total Assets - Current Liabilities)
Or for China Nonferrous Mining:
0.14 = US$310m ÷ (US$3.1b - US$842m) (Based on the trailing twelve months to June 2019.)
So, China Nonferrous Mining has an ROCE of 14%.
Check out our latest analysis for China Nonferrous Mining
Is China Nonferrous Mining's ROCE Good?
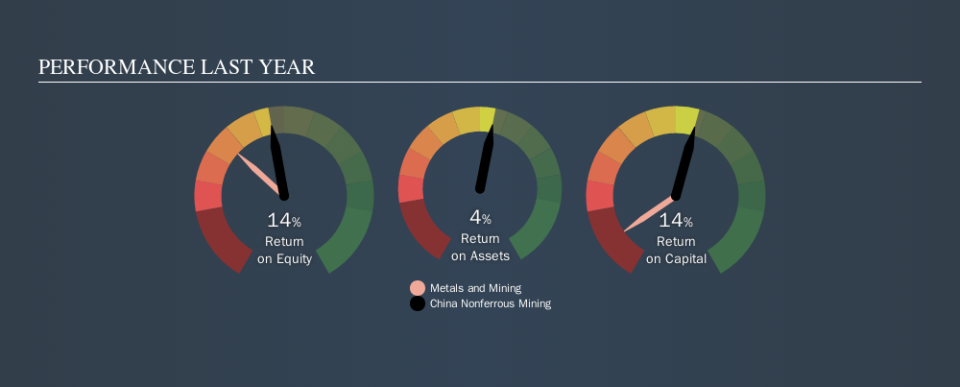
One way to assess ROCE is to compare similar companies. Using our data, we find that China Nonferrous Mining's ROCE is meaningfully better than the 8.1% average in the Metals and Mining industry. We would consider this a positive, as it suggests it is using capital more effectively than other similar companies. Separate from China Nonferrous Mining's performance relative to its industry, its ROCE in absolute terms looks satisfactory, and it may be worth researching in more depth.
China Nonferrous Mining has an ROCE of 14%, but it didn't have an ROCE 3 years ago, since it was unprofitable. That suggests the business has returned to profitability. You can see in the image below how China Nonferrous Mining's ROCE compares to its industry. Click to see more on past growth.
When considering ROCE, bear in mind that it reflects the past and does not necessarily predict the future. Companies in cyclical industries can be difficult to understand using ROCE, as returns typically look high during boom times, and low during busts. ROCE is only a point-in-time measure. Remember that most companies like China Nonferrous Mining are cyclical businesses. You can check if China Nonferrous Mining has cyclical profits by looking at this free graph of past earnings, revenue and cash flow.
Do China Nonferrous Mining's Current Liabilities Skew Its ROCE?
Short term (or current) liabilities, are things like supplier invoices, overdrafts, or tax bills that need to be paid within 12 months. Due to the way the ROCE equation works, having large bills due in the near term can make it look as though a company has less capital employed, and thus a higher ROCE than usual. To counteract this, we check if a company has high current liabilities, relative to its total assets.
China Nonferrous Mining has total assets of US$3.1b and current liabilities of US$842m. Therefore its current liabilities are equivalent to approximately 27% of its total assets. A fairly low level of current liabilities is not influencing the ROCE too much.
What We Can Learn From China Nonferrous Mining's ROCE
This is good to see, and with a sound ROCE, China Nonferrous Mining could be worth a closer look. China Nonferrous Mining looks strong on this analysis, but there are plenty of other companies that could be a good opportunity . Here is a free list of companies growing earnings rapidly.
If you like to buy stocks alongside management, then you might just love this free list of companies. (Hint: insiders have been buying them).
We aim to bring you long-term focused research analysis driven by fundamental data. Note that our analysis may not factor in the latest price-sensitive company announcements or qualitative material.
If you spot an error that warrants correction, please contact the editor at editorial-team@simplywallst.com. This article by Simply Wall St is general in nature. It does not constitute a recommendation to buy or sell any stock, and does not take account of your objectives, or your financial situation. Simply Wall St has no position in the stocks mentioned. Thank you for reading.
