Is China Tianrui Group Cement Company Limited (HKG:1252) Better Than Average At Deploying Capital?

Today we are going to look at China Tianrui Group Cement Company Limited (HKG:1252) to see whether it might be an attractive investment prospect. To be precise, we'll consider its Return On Capital Employed (ROCE), as that will inform our view of the quality of the business.
First up, we'll look at what ROCE is and how we calculate it. Second, we'll look at its ROCE compared to similar companies. Then we'll determine how its current liabilities are affecting its ROCE.
What is Return On Capital Employed (ROCE)?
ROCE measures the 'return' (pre-tax profit) a company generates from capital employed in its business. Generally speaking a higher ROCE is better. In brief, it is a useful tool, but it is not without drawbacks. Renowned investment researcher Michael Mauboussin has suggested that a high ROCE can indicate that 'one dollar invested in the company generates value of more than one dollar'.
How Do You Calculate Return On Capital Employed?
Analysts use this formula to calculate return on capital employed:
Return on Capital Employed = Earnings Before Interest and Tax (EBIT) ÷ (Total Assets - Current Liabilities)
Or for China Tianrui Group Cement:
0.15 = CN¥2.4b ÷ (CN¥29b - CN¥13b) (Based on the trailing twelve months to December 2018.)
Therefore, China Tianrui Group Cement has an ROCE of 15%.
Check out our latest analysis for China Tianrui Group Cement
Does China Tianrui Group Cement Have A Good ROCE?
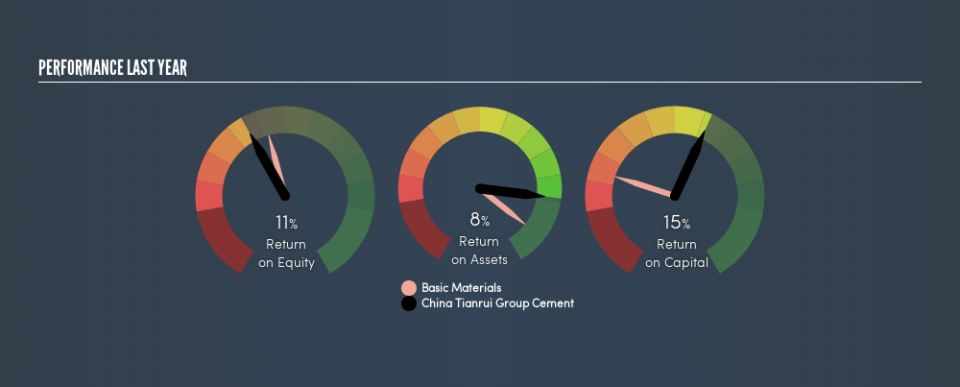
ROCE is commonly used for comparing the performance of similar businesses. We can see China Tianrui Group Cement's ROCE is around the 18% average reported by the Basic Materials industry. Separate from China Tianrui Group Cement's performance relative to its industry, its ROCE in absolute terms looks satisfactory, and it may be worth researching in more depth.
Our data shows that China Tianrui Group Cement currently has an ROCE of 15%, compared to its ROCE of 3.4% 3 years ago. This makes us think about whether the company has been reinvesting shrewdly. You can see in the image below how China Tianrui Group Cement's ROCE compares to its industry. Click to see more on past growth.
Remember that this metric is backwards looking - it shows what has happened in the past, and does not accurately predict the future. ROCE can be deceptive for cyclical businesses, as returns can look incredible in boom times, and terribly low in downturns. ROCE is only a point-in-time measure. You can check if China Tianrui Group Cement has cyclical profits by looking at this free graph of past earnings, revenue and cash flow.
Do China Tianrui Group Cement's Current Liabilities Skew Its ROCE?
Current liabilities are short term bills and invoices that need to be paid in 12 months or less. Due to the way ROCE is calculated, a high level of current liabilities makes a company look as though it has less capital employed, and thus can (sometimes unfairly) boost the ROCE. To counteract this, we check if a company has high current liabilities, relative to its total assets.
China Tianrui Group Cement has total liabilities of CN¥13b and total assets of CN¥29b. Therefore its current liabilities are equivalent to approximately 44% of its total assets. China Tianrui Group Cement has a medium level of current liabilities, which would boost the ROCE.
What We Can Learn From China Tianrui Group Cement's ROCE
China Tianrui Group Cement's ROCE does look good, but the level of current liabilities also contribute to that. China Tianrui Group Cement looks strong on this analysis, but there are plenty of other companies that could be a good opportunity . Here is a free list of companies growing earnings rapidly.
For those who like to find winning investments this free list of growing companies with recent insider purchasing, could be just the ticket.
We aim to bring you long-term focused research analysis driven by fundamental data. Note that our analysis may not factor in the latest price-sensitive company announcements or qualitative material.
If you spot an error that warrants correction, please contact the editor at editorial-team@simplywallst.com. This article by Simply Wall St is general in nature. It does not constitute a recommendation to buy or sell any stock, and does not take account of your objectives, or your financial situation. Simply Wall St has no position in the stocks mentioned. Thank you for reading.

