China Unicom (Hong Kong) Limited’s (HKG:762) Investment Returns Are Lagging Its Industry

Today we are going to look at China Unicom (Hong Kong) Limited (HKG:762) to see whether it might be an attractive investment prospect. Specifically, we're going to calculate its Return On Capital Employed (ROCE), in the hopes of getting some insight into the business.
First of all, we'll work out how to calculate ROCE. Then we'll compare its ROCE to similar companies. Last but not least, we'll look at what impact its current liabilities have on its ROCE.
What is Return On Capital Employed (ROCE)?
ROCE is a metric for evaluating how much pre-tax income (in percentage terms) a company earns on the capital invested in its business. All else being equal, a better business will have a higher ROCE. Ultimately, it is a useful but imperfect metric. Author Edwin Whiting says to be careful when comparing the ROCE of different businesses, since 'No two businesses are exactly alike.
So, How Do We Calculate ROCE?
Analysts use this formula to calculate return on capital employed:
Return on Capital Employed = Earnings Before Interest and Tax (EBIT) ÷ (Total Assets - Current Liabilities)
Or for China Unicom (Hong Kong):
0.043 = CN¥15b ÷ (CN¥565b - CN¥211b) (Based on the trailing twelve months to September 2019.)
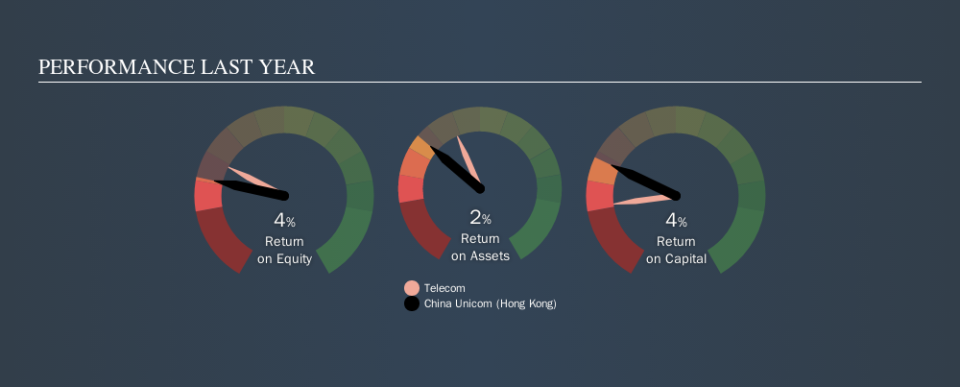
So, China Unicom (Hong Kong) has an ROCE of 4.3%.
View our latest analysis for China Unicom (Hong Kong)
Does China Unicom (Hong Kong) Have A Good ROCE?
ROCE is commonly used for comparing the performance of similar businesses. In this analysis, China Unicom (Hong Kong)'s ROCE appears meaningfully below the 6.7% average reported by the Telecom industry. This performance could be negative if sustained, as it suggests the business may underperform its industry. Independently of how China Unicom (Hong Kong) compares to its industry, its ROCE in absolute terms is low; especially compared to the ~2.0% available in government bonds. Readers may wish to look for more rewarding investments.
We can see that, China Unicom (Hong Kong) currently has an ROCE of 4.3% compared to its ROCE 3 years ago, which was 0.3%. This makes us think the business might be improving. You can click on the image below to see (in greater detail) how China Unicom (Hong Kong)'s past growth compares to other companies.
When considering ROCE, bear in mind that it reflects the past and does not necessarily predict the future. Companies in cyclical industries can be difficult to understand using ROCE, as returns typically look high during boom times, and low during busts. This is because ROCE only looks at one year, instead of considering returns across a whole cycle. Since the future is so important for investors, you should check out our free report on analyst forecasts for China Unicom (Hong Kong).
Do China Unicom (Hong Kong)'s Current Liabilities Skew Its ROCE?
Short term (or current) liabilities, are things like supplier invoices, overdrafts, or tax bills that need to be paid within 12 months. Due to the way the ROCE equation works, having large bills due in the near term can make it look as though a company has less capital employed, and thus a higher ROCE than usual. To check the impact of this, we calculate if a company has high current liabilities relative to its total assets.
China Unicom (Hong Kong) has total assets of CN¥565b and current liabilities of CN¥211b. Therefore its current liabilities are equivalent to approximately 37% of its total assets. With a medium level of current liabilities boosting the ROCE a little, China Unicom (Hong Kong)'s low ROCE is unappealing.
The Bottom Line On China Unicom (Hong Kong)'s ROCE
This company may not be the most attractive investment prospect. But note: make sure you look for a great company, not just the first idea you come across. So take a peek at this free list of interesting companies with strong recent earnings growth (and a P/E ratio below 20).
If you are like me, then you will not want to miss this free list of growing companies that insiders are buying.
We aim to bring you long-term focused research analysis driven by fundamental data. Note that our analysis may not factor in the latest price-sensitive company announcements or qualitative material.
If you spot an error that warrants correction, please contact the editor at editorial-team@simplywallst.com. This article by Simply Wall St is general in nature. It does not constitute a recommendation to buy or sell any stock, and does not take account of your objectives, or your financial situation. Simply Wall St has no position in the stocks mentioned. Thank you for reading.
