Is Clariant AG (VTX:CLN) A Good Dividend Stock?

Dividend paying stocks like Clariant AG (VTX:CLN) tend to be popular with investors, and for good reason - some research suggests a significant amount of all stock market returns come from reinvested dividends. On the other hand, investors have been known to buy a stock because of its yield, and then lose money if the company's dividend doesn't live up to expectations.
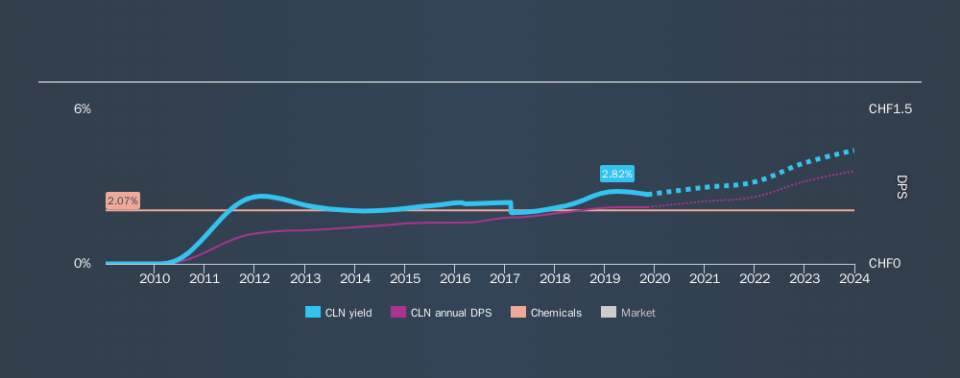
Investors might not know much about Clariant's dividend prospects, even though it has been paying dividends for the last eight years and offers a 2.7% yield. While the yield may not look too great, the relatively long payment history is interesting. Some simple research can reduce the risk of buying Clariant for its dividend - read on to learn more.
Explore this interactive chart for our latest analysis on Clariant!
Payout ratios
Companies (usually) pay dividends out of their earnings. If a company is paying more than it earns, the dividend might have to be cut. As a result, we should always investigate whether a company can afford its dividend, measured as a percentage of a company's net income after tax. Clariant paid out 227% of its profit as dividends, over the trailing twelve month period. Unless there are extenuating circumstances, from the perspective of an investor who hopes to own the company for many years, a payout ratio of above 100% is definitely a concern.
We also measure dividends paid against a company's levered free cash flow, to see if enough cash was generated to cover the dividend. The company paid out 66% of its free cash flow, which is not bad per se, but does start to limit the amount of cash Clariant has available to meet other needs. It's disappointing to see that the dividend was not covered by profits, but cash is more important from a dividend sustainability perspective, and Clariant fortunately did generate enough cash to fund its dividend. If executives were to continue paying more in dividends than the company reported in profits, we'd view this as a warning sign. Extraordinarily few companies are capable of persistently paying a dividend that is greater than their profits.
Is Clariant's Balance Sheet Risky?
As Clariant's dividend was not well covered by earnings, we need to check its balance sheet for signs of financial distress. A quick check of its financial situation can be done with two ratios: net debt divided by EBITDA (earnings before interest, tax, depreciation and amortisation), and net interest cover. Net debt to EBITDA is a measure of a company's total debt. Net interest cover measures the ability to meet interest payments. Essentially we check that a) the company does not have too much debt, and b) that it can afford to pay the interest. Clariant has net debt of 1.94 times its EBITDA, which is generally an okay level of debt for most companies.
We calculated its interest cover by measuring its earnings before interest and tax (EBIT), and dividing this by the company's net interest expense. Net interest cover of 6.39 times its interest expense appears reasonable for Clariant, although we're conscious that even high interest cover doesn't make a company bulletproof.
Remember, you can always get a snapshot of Clariant's latest financial position, by checking our visualisation of its financial health.
Dividend Volatility
From the perspective of an income investor who wants to earn dividends for many years, there is not much point buying a stock if its dividend is regularly cut or is not reliable. The first recorded dividend for Clariant, in the last decade, was eight years ago. The company has been paying a stable dividend for a while now, which is great. However we'd prefer to see consistency for a few more years before giving it our full seal of approval. During the past eight-year period, the first annual payment was CHF0.30 in 2011, compared to CHF0.55 last year. This works out to be a compound annual growth rate (CAGR) of approximately 7.9% a year over that time.
The dividend has been growing at a reasonable rate, which we like. We're conscious though that one of the best ways to detect a multi-decade consistent dividend-payer, is to watch a company pay dividends for 20 years - a distinction Clariant has not achieved yet.
Dividend Growth Potential
While dividend payments have been relatively reliable, it would also be nice if earnings per share (EPS) were growing, as this is essential to maintaining the dividend's purchasing power over the long term. Clariant's earnings per share have shrunk at 24% a year over the past five years. With this kind of significant decline, we always wonder what has changed in the business. Dividends are about stability, and Clariant's earnings per share, which support the dividend, have been anything but stable.
Conclusion
When we look at a dividend stock, we need to form a judgement on whether the dividend will grow, if the company is able to maintain it in a wide range of economic circumstances, and if the dividend payout is sustainable. We're not keen on the fact that Clariant paid out such a high percentage of its income, although its cashflow is in better shape. Earnings per share are down, and to our mind Clariant has not been paying a dividend long enough to demonstrate its resilience across economic cycles. In this analysis, Clariant doesn't shape up too well as a dividend stock. We'd find it hard to look past the flaws, and would not be inclined to think of it as a reliable dividend-payer.
Given that earnings are not growing, the dividend does not look nearly so attractive. Very few businesses see earnings consistently shrink year after year in perpetuity though, and so it might be worth seeing what the 10 analysts we track are forecasting for the future.
We have also put together a list of global stocks with a market capitalisation above $1bn and yielding more 3%.
We aim to bring you long-term focused research analysis driven by fundamental data. Note that our analysis may not factor in the latest price-sensitive company announcements or qualitative material.
If you spot an error that warrants correction, please contact the editor at editorial-team@simplywallst.com. This article by Simply Wall St is general in nature. It does not constitute a recommendation to buy or sell any stock, and does not take account of your objectives, or your financial situation. Simply Wall St has no position in the stocks mentioned. Thank you for reading.

