Is Clariant Chemicals (India) Limited (NSE:CLNINDIA) Investing Your Capital Efficiently?

Today we'll evaluate Clariant Chemicals (India) Limited (NSE:CLNINDIA) to determine whether it could have potential as an investment idea. In particular, we'll consider its Return On Capital Employed (ROCE), as that can give us insight into how profitably the company is able to employ capital in its business.
Firstly, we'll go over how we calculate ROCE. Second, we'll look at its ROCE compared to similar companies. Finally, we'll look at how its current liabilities affect its ROCE.
Understanding Return On Capital Employed (ROCE)
ROCE measures the 'return' (pre-tax profit) a company generates from capital employed in its business. All else being equal, a better business will have a higher ROCE. Overall, it is a valuable metric that has its flaws. Renowned investment researcher Michael Mauboussin has suggested that a high ROCE can indicate that 'one dollar invested in the company generates value of more than one dollar'.
How Do You Calculate Return On Capital Employed?
Analysts use this formula to calculate return on capital employed:
Return on Capital Employed = Earnings Before Interest and Tax (EBIT) ÷ (Total Assets - Current Liabilities)
Or for Clariant Chemicals (India):
0.046 = ₹298m ÷ (₹8.9b - ₹2.5b) (Based on the trailing twelve months to June 2019.)
Therefore, Clariant Chemicals (India) has an ROCE of 4.6%.
See our latest analysis for Clariant Chemicals (India)
Does Clariant Chemicals (India) Have A Good ROCE?
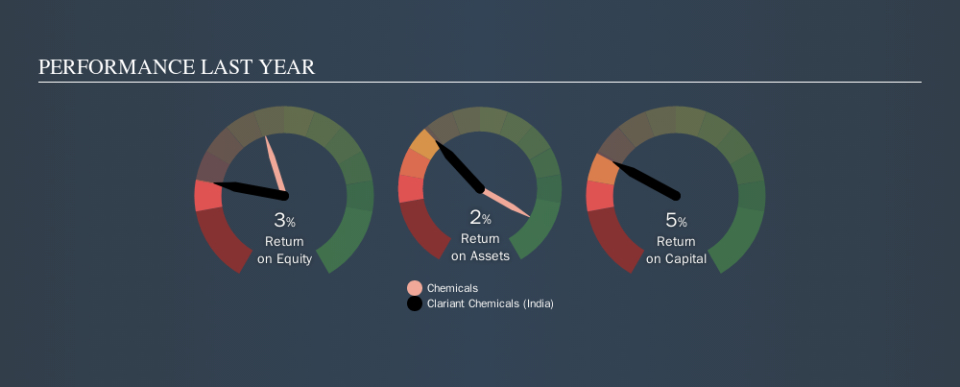
One way to assess ROCE is to compare similar companies. Using our data, Clariant Chemicals (India)'s ROCE appears to be significantly below the 17% average in the Chemicals industry. This could be seen as a negative, as it suggests some competitors may be employing their capital more efficiently. Independently of how Clariant Chemicals (India) compares to its industry, its ROCE in absolute terms is low; especially compared to the ~7.6% available in government bonds. It is likely that there are more attractive prospects out there.
You can see in the image below how Clariant Chemicals (India)'s ROCE compares to its industry. Click to see more on past growth.
It is important to remember that ROCE shows past performance, and is not necessarily predictive. Companies in cyclical industries can be difficult to understand using ROCE, as returns typically look high during boom times, and low during busts. ROCE is, after all, simply a snap shot of a single year. You can check if Clariant Chemicals (India) has cyclical profits by looking at this free graph of past earnings, revenue and cash flow.
How Clariant Chemicals (India)'s Current Liabilities Impact Its ROCE
Short term (or current) liabilities, are things like supplier invoices, overdrafts, or tax bills that need to be paid within 12 months. The ROCE equation subtracts current liabilities from capital employed, so a company with a lot of current liabilities appears to have less capital employed, and a higher ROCE than otherwise. To check the impact of this, we calculate if a company has high current liabilities relative to its total assets.
Clariant Chemicals (India) has total assets of ₹8.9b and current liabilities of ₹2.5b. As a result, its current liabilities are equal to approximately 28% of its total assets. With a very reasonable level of current liabilities, so the impact on ROCE is fairly minimal.
Our Take On Clariant Chemicals (India)'s ROCE
While that is good to see, Clariant Chemicals (India) has a low ROCE and does not look attractive in this analysis. Of course, you might find a fantastic investment by looking at a few good candidates. So take a peek at this free list of companies with modest (or no) debt, trading on a P/E below 20.
If you like to buy stocks alongside management, then you might just love this free list of companies. (Hint: insiders have been buying them).
We aim to bring you long-term focused research analysis driven by fundamental data. Note that our analysis may not factor in the latest price-sensitive company announcements or qualitative material.
If you spot an error that warrants correction, please contact the editor at editorial-team@simplywallst.com. This article by Simply Wall St is general in nature. It does not constitute a recommendation to buy or sell any stock, and does not take account of your objectives, or your financial situation. Simply Wall St has no position in the stocks mentioned. Thank you for reading.
