Is Clarus Corporation (NASDAQ:CLAR) Investing Your Capital Efficiently?

Today we are going to look at Clarus Corporation (NASDAQ:CLAR) to see whether it might be an attractive investment prospect. Specifically, we're going to calculate its Return On Capital Employed (ROCE), in the hopes of getting some insight into the business.
First of all, we'll work out how to calculate ROCE. Next, we'll compare it to others in its industry. Then we'll determine how its current liabilities are affecting its ROCE.
What is Return On Capital Employed (ROCE)?
ROCE is a measure of a company's yearly pre-tax profit (its return), relative to the capital employed in the business. In general, businesses with a higher ROCE are usually better quality. Ultimately, it is a useful but imperfect metric. Renowned investment researcher Michael Mauboussin has suggested that a high ROCE can indicate that 'one dollar invested in the company generates value of more than one dollar'.
So, How Do We Calculate ROCE?
The formula for calculating the return on capital employed is:
Return on Capital Employed = Earnings Before Interest and Tax (EBIT) ÷ (Total Assets - Current Liabilities)
Or for Clarus:
0.071 = US$14m ÷ (US$212m - US$20m) (Based on the trailing twelve months to March 2019.)
Therefore, Clarus has an ROCE of 7.1%.
See our latest analysis for Clarus
Is Clarus's ROCE Good?
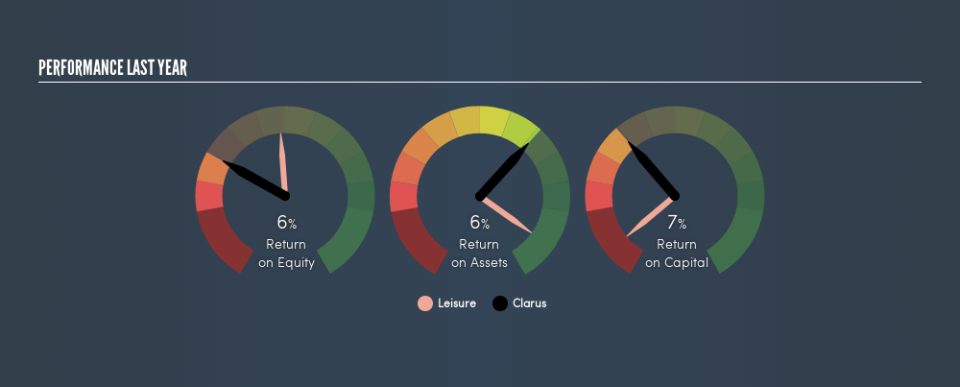
When making comparisons between similar businesses, investors may find ROCE useful. In this analysis, Clarus's ROCE appears meaningfully below the 16% average reported by the Leisure industry. This performance is not ideal, as it suggests the company may not be deploying its capital as effectively as some competitors. Separate from how Clarus stacks up against its industry, its ROCE in absolute terms is mediocre; relative to the returns on government bonds. It is possible that there are more rewarding investments out there.
Clarus has an ROCE of 7.1%, but it didn't have an ROCE 3 years ago, since it was unprofitable. That suggests the business has returned to profitability. You can see in the image below how Clarus's ROCE compares to its industry. Click to see more on past growth.
When considering this metric, keep in mind that it is backwards looking, and not necessarily predictive. Companies in cyclical industries can be difficult to understand using ROCE, as returns typically look high during boom times, and low during busts. ROCE is only a point-in-time measure. What happens in the future is pretty important for investors, so we have prepared a free report on analyst forecasts for Clarus.
Clarus's Current Liabilities And Their Impact On Its ROCE
Current liabilities are short term bills and invoices that need to be paid in 12 months or less. Due to the way the ROCE equation works, having large bills due in the near term can make it look as though a company has less capital employed, and thus a higher ROCE than usual. To counteract this, we check if a company has high current liabilities, relative to its total assets.
Clarus has total assets of US$212m and current liabilities of US$20m. Therefore its current liabilities are equivalent to approximately 9.7% of its total assets. Clarus has a low level of current liabilities, which have a minimal impact on its uninspiring ROCE.
What We Can Learn From Clarus's ROCE
Based on this information, Clarus appears to be a mediocre business. But note: make sure you look for a great company, not just the first idea you come across. So take a peek at this free list of interesting companies with strong recent earnings growth (and a P/E ratio below 20).
If you like to buy stocks alongside management, then you might just love this free list of companies. (Hint: insiders have been buying them).
We aim to bring you long-term focused research analysis driven by fundamental data. Note that our analysis may not factor in the latest price-sensitive company announcements or qualitative material.
If you spot an error that warrants correction, please contact the editor at editorial-team@simplywallst.com. This article by Simply Wall St is general in nature. It does not constitute a recommendation to buy or sell any stock, and does not take account of your objectives, or your financial situation. Simply Wall St has no position in the stocks mentioned. Thank you for reading.
