What Can We Make Of CLERHP Estructuras, S.A.’s (BME:CLR) High Return On Capital?

Want to participate in a short research study? Help shape the future of investing tools and you could win a $250 gift card!
Today we'll evaluate CLERHP Estructuras, S.A. (BME:CLR) to determine whether it could have potential as an investment idea. To be precise, we'll consider its Return On Capital Employed (ROCE), as that will inform our view of the quality of the business.
First of all, we'll work out how to calculate ROCE. Then we'll compare its ROCE to similar companies. Finally, we'll look at how its current liabilities affect its ROCE.
Return On Capital Employed (ROCE): What is it?
ROCE measures the 'return' (pre-tax profit) a company generates from capital employed in its business. In general, businesses with a higher ROCE are usually better quality. Ultimately, it is a useful but imperfect metric. Author Edwin Whiting says to be careful when comparing the ROCE of different businesses, since 'No two businesses are exactly alike.'
How Do You Calculate Return On Capital Employed?
The formula for calculating the return on capital employed is:
Return on Capital Employed = Earnings Before Interest and Tax (EBIT) ÷ (Total Assets - Current Liabilities)
Or for CLERHP Estructuras:
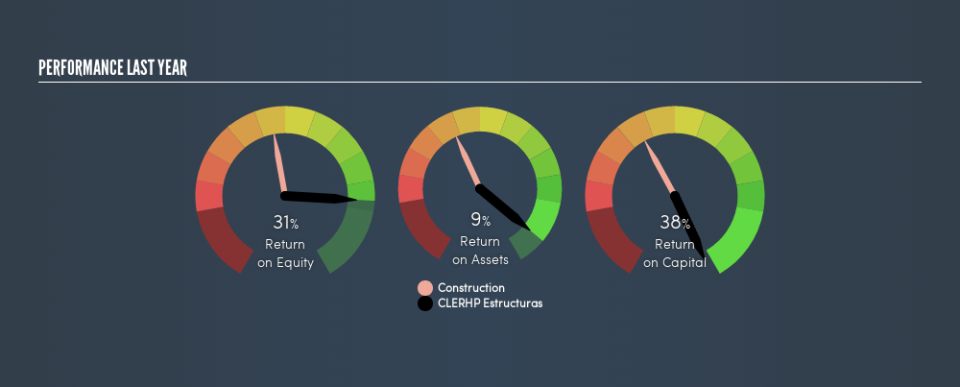
0.38 = €1.5m ÷ (€10m - €6.1m) (Based on the trailing twelve months to December 2018.)
So, CLERHP Estructuras has an ROCE of 38%.
See our latest analysis for CLERHP Estructuras
Is CLERHP Estructuras's ROCE Good?
ROCE is commonly used for comparing the performance of similar businesses. Using our data, we find that CLERHP Estructuras's ROCE is meaningfully better than the 5.7% average in the Construction industry. We consider this a positive sign, because it suggests it uses capital more efficiently than similar companies. Regardless of the industry comparison, in absolute terms, CLERHP Estructuras's ROCE currently appears to be excellent.
Our data shows that CLERHP Estructuras currently has an ROCE of 38%, compared to its ROCE of 8.6% 3 years ago. This makes us think about whether the company has been reinvesting shrewdly. You can see in the image below how CLERHP Estructuras's ROCE compares to its industry. Click to see more on past growth.
When considering this metric, keep in mind that it is backwards looking, and not necessarily predictive. ROCE can be misleading for companies in cyclical industries, with returns looking impressive during the boom times, but very weak during the busts. ROCE is only a point-in-time measure. How cyclical is CLERHP Estructuras? You can see for yourself by looking at this free graph of past earnings, revenue and cash flow.
How CLERHP Estructuras's Current Liabilities Impact Its ROCE
Short term (or current) liabilities, are things like supplier invoices, overdrafts, or tax bills that need to be paid within 12 months. Due to the way the ROCE equation works, having large bills due in the near term can make it look as though a company has less capital employed, and thus a higher ROCE than usual. To counter this, investors can check if a company has high current liabilities relative to total assets.
CLERHP Estructuras has total assets of €10m and current liabilities of €6.1m. Therefore its current liabilities are equivalent to approximately 60% of its total assets. CLERHP Estructuras boasts an attractive ROCE, even after considering the boost from high current liabilities.
Our Take On CLERHP Estructuras's ROCE
So to us, the company is potentially worth investigating further. CLERHP Estructuras shapes up well under this analysis, but it is far from the only business delivering excellent numbers . You might also want to check this free collection of companies delivering excellent earnings growth.
If you are like me, then you will not want to miss this free list of growing companies that insiders are buying.
We aim to bring you long-term focused research analysis driven by fundamental data. Note that our analysis may not factor in the latest price-sensitive company announcements or qualitative material.
If you spot an error that warrants correction, please contact the editor at editorial-team@simplywallst.com. This article by Simply Wall St is general in nature. It does not constitute a recommendation to buy or sell any stock, and does not take account of your objectives, or your financial situation. Simply Wall St has no position in the stocks mentioned. Thank you for reading.

