Are Cleveland-Cliffs Inc.’s (NYSE:CLF) High Returns Really That Great?

Today we'll evaluate Cleveland-Cliffs Inc. (NYSE:CLF) to determine whether it could have potential as an investment idea. Specifically, we're going to calculate its Return On Capital Employed (ROCE), in the hopes of getting some insight into the business.
Firstly, we'll go over how we calculate ROCE. Second, we'll look at its ROCE compared to similar companies. Last but not least, we'll look at what impact its current liabilities have on its ROCE.
Return On Capital Employed (ROCE): What is it?
ROCE is a measure of a company's yearly pre-tax profit (its return), relative to the capital employed in the business. Generally speaking a higher ROCE is better. Ultimately, it is a useful but imperfect metric. Renowned investment researcher Michael Mauboussin has suggested that a high ROCE can indicate that 'one dollar invested in the company generates value of more than one dollar'.
How Do You Calculate Return On Capital Employed?
Analysts use this formula to calculate return on capital employed:
Return on Capital Employed = Earnings Before Interest and Tax (EBIT) ÷ (Total Assets - Current Liabilities)
Or for Cleveland-Cliffs:
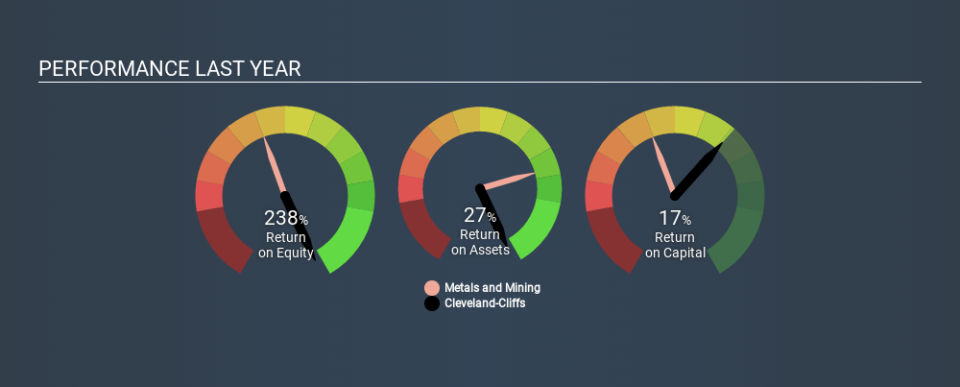
0.17 = US$516m ÷ (US$3.5b - US$459m) (Based on the trailing twelve months to September 2019.)
So, Cleveland-Cliffs has an ROCE of 17%.
View our latest analysis for Cleveland-Cliffs
Does Cleveland-Cliffs Have A Good ROCE?
ROCE can be useful when making comparisons, such as between similar companies. Cleveland-Cliffs's ROCE appears to be substantially greater than the 8.7% average in the Metals and Mining industry. I think that's good to see, since it implies the company is better than other companies at making the most of its capital. Regardless of where Cleveland-Cliffs sits next to its industry, its ROCE in absolute terms appears satisfactory, and this company could be worth a closer look.
Our data shows that Cleveland-Cliffs currently has an ROCE of 17%, compared to its ROCE of 9.5% 3 years ago. This makes us wonder if the company is improving. You can see in the image below how Cleveland-Cliffs's ROCE compares to its industry. Click to see more on past growth.
When considering this metric, keep in mind that it is backwards looking, and not necessarily predictive. ROCE can be deceptive for cyclical businesses, as returns can look incredible in boom times, and terribly low in downturns. ROCE is only a point-in-time measure. Given the industry it operates in, Cleveland-Cliffs could be considered cyclical. What happens in the future is pretty important for investors, so we have prepared a free report on analyst forecasts for Cleveland-Cliffs.
How Cleveland-Cliffs's Current Liabilities Impact Its ROCE
Liabilities, such as supplier bills and bank overdrafts, are referred to as current liabilities if they need to be paid within 12 months. Due to the way ROCE is calculated, a high level of current liabilities makes a company look as though it has less capital employed, and thus can (sometimes unfairly) boost the ROCE. To counteract this, we check if a company has high current liabilities, relative to its total assets.
Cleveland-Cliffs has total assets of US$3.5b and current liabilities of US$459m. Therefore its current liabilities are equivalent to approximately 13% of its total assets. Current liabilities are minimal, limiting the impact on ROCE.
Our Take On Cleveland-Cliffs's ROCE
Overall, Cleveland-Cliffs has a decent ROCE and could be worthy of further research. Cleveland-Cliffs shapes up well under this analysis, but it is far from the only business delivering excellent numbers . You might also want to check this free collection of companies delivering excellent earnings growth.
If you like to buy stocks alongside management, then you might just love this free list of companies. (Hint: insiders have been buying them).
If you spot an error that warrants correction, please contact the editor at editorial-team@simplywallst.com. This article by Simply Wall St is general in nature. It does not constitute a recommendation to buy or sell any stock, and does not take account of your objectives, or your financial situation. Simply Wall St has no position in the stocks mentioned.
We aim to bring you long-term focused research analysis driven by fundamental data. Note that our analysis may not factor in the latest price-sensitive company announcements or qualitative material. Thank you for reading.
