A Close Look At Cadsys (India) Limited’s (NSE:CADSYS) 21% ROCE

Want to participate in a short research study? Help shape the future of investing tools and you could win a $250 gift card!
Today we'll look at Cadsys (India) Limited (NSE:CADSYS) and reflect on its potential as an investment. In particular, we'll consider its Return On Capital Employed (ROCE), as that can give us insight into how profitably the company is able to employ capital in its business.
Firstly, we'll go over how we calculate ROCE. Next, we'll compare it to others in its industry. And finally, we'll look at how its current liabilities are impacting its ROCE.
What is Return On Capital Employed (ROCE)?
ROCE measures the 'return' (pre-tax profit) a company generates from capital employed in its business. In general, businesses with a higher ROCE are usually better quality. Ultimately, it is a useful but imperfect metric. Renowned investment researcher Michael Mauboussin has suggested that a high ROCE can indicate that 'one dollar invested in the company generates value of more than one dollar'.
So, How Do We Calculate ROCE?
Analysts use this formula to calculate return on capital employed:
Return on Capital Employed = Earnings Before Interest and Tax (EBIT) ÷ (Total Assets - Current Liabilities)
Or for Cadsys (India):
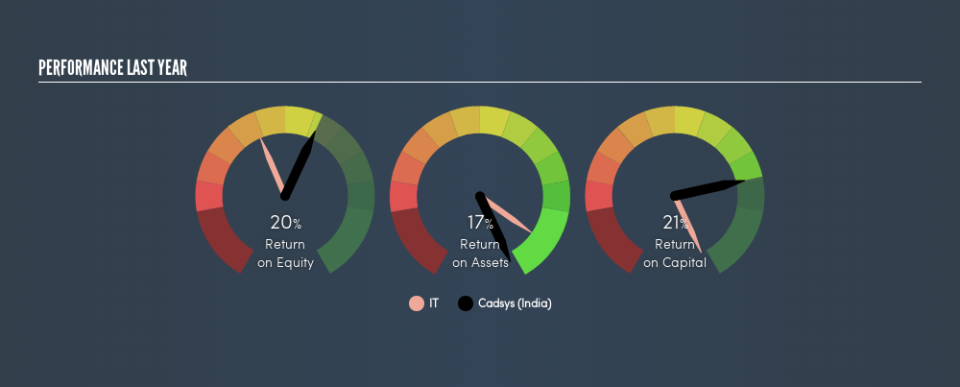
0.21 = ₹144m ÷ (₹748m - ₹72m) (Based on the trailing twelve months to March 2019.)
Therefore, Cadsys (India) has an ROCE of 21%.
Check out our latest analysis for Cadsys (India)
Does Cadsys (India) Have A Good ROCE?
ROCE can be useful when making comparisons, such as between similar companies. Cadsys (India)'s ROCE appears to be substantially greater than the 14% average in the IT industry. We consider this a positive sign, because it suggests it uses capital more efficiently than similar companies. Separate from Cadsys (India)'s performance relative to its industry, its ROCE in absolute terms looks satisfactory, and it may be worth researching in more depth.
Cadsys (India)'s current ROCE of 21% is lower than 3 years ago, when the company reported a 37% ROCE. This makes us wonder if the business is facing new challenges.
When considering ROCE, bear in mind that it reflects the past and does not necessarily predict the future. ROCE can be misleading for companies in cyclical industries, with returns looking impressive during the boom times, but very weak during the busts. ROCE is only a point-in-time measure. How cyclical is Cadsys (India)? You can see for yourself by looking at this free graph of past earnings, revenue and cash flow.
Do Cadsys (India)'s Current Liabilities Skew Its ROCE?
Short term (or current) liabilities, are things like supplier invoices, overdrafts, or tax bills that need to be paid within 12 months. Due to the way the ROCE equation works, having large bills due in the near term can make it look as though a company has less capital employed, and thus a higher ROCE than usual. To counter this, investors can check if a company has high current liabilities relative to total assets.
Cadsys (India) has total assets of ₹748m and current liabilities of ₹72m. As a result, its current liabilities are equal to approximately 9.6% of its total assets. Low current liabilities have only a minimal impact on Cadsys (India)'s ROCE, making its decent returns more credible.
The Bottom Line On Cadsys (India)'s ROCE
If it is able to keep this up, Cadsys (India) could be attractive. Cadsys (India) shapes up well under this analysis, but it is far from the only business delivering excellent numbers . You might also want to check this free collection of companies delivering excellent earnings growth.
If you like to buy stocks alongside management, then you might just love this free list of companies. (Hint: insiders have been buying them).
We aim to bring you long-term focused research analysis driven by fundamental data. Note that our analysis may not factor in the latest price-sensitive company announcements or qualitative material.
If you spot an error that warrants correction, please contact the editor at editorial-team@simplywallst.com. This article by Simply Wall St is general in nature. It does not constitute a recommendation to buy or sell any stock, and does not take account of your objectives, or your financial situation. Simply Wall St has no position in the stocks mentioned. Thank you for reading.
