A Close Look At S.A.S. Dragon Holdings Limited’s (HKG:1184) 25% ROCE

Today we'll look at S.A.S. Dragon Holdings Limited (HKG:1184) and reflect on its potential as an investment. In particular, we'll consider its Return On Capital Employed (ROCE), as that can give us insight into how profitably the company is able to employ capital in its business.
Firstly, we'll go over how we calculate ROCE. Next, we'll compare it to others in its industry. And finally, we'll look at how its current liabilities are impacting its ROCE.
Return On Capital Employed (ROCE): What is it?
ROCE measures the amount of pre-tax profits a company can generate from the capital employed in its business. In general, businesses with a higher ROCE are usually better quality. Ultimately, it is a useful but imperfect metric. Renowned investment researcher Michael Mauboussin has suggested that a high ROCE can indicate that 'one dollar invested in the company generates value of more than one dollar'.
How Do You Calculate Return On Capital Employed?
The formula for calculating the return on capital employed is:
Return on Capital Employed = Earnings Before Interest and Tax (EBIT) ÷ (Total Assets - Current Liabilities)
Or for S.A.S. Dragon Holdings:
0.25 = HK$513m ÷ (HK$6.6b - HK$4.6b) (Based on the trailing twelve months to December 2018.)
So, S.A.S. Dragon Holdings has an ROCE of 25%.
Want to participate in a short research study? Help shape the future of investing tools and you could win a $250 gift card!
Check out our latest analysis for S.A.S. Dragon Holdings
Does S.A.S. Dragon Holdings Have A Good ROCE?
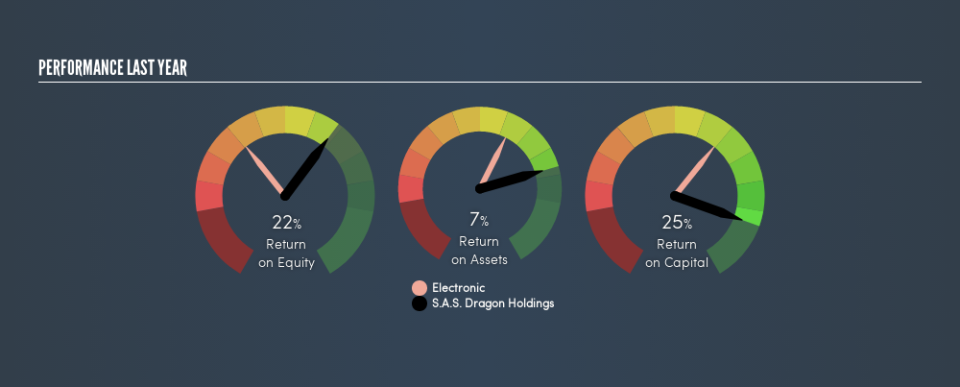
One way to assess ROCE is to compare similar companies. Using our data, we find that S.A.S. Dragon Holdings's ROCE is meaningfully better than the 9.9% average in the Electronic industry. I think that's good to see, since it implies the company is better than other companies at making the most of its capital. Regardless of the industry comparison, in absolute terms, S.A.S. Dragon Holdings's ROCE currently appears to be excellent.
Our data shows that S.A.S. Dragon Holdings currently has an ROCE of 25%, compared to its ROCE of 17% 3 years ago. This makes us think the business might be improving.
Remember that this metric is backwards looking - it shows what has happened in the past, and does not accurately predict the future. ROCE can be deceptive for cyclical businesses, as returns can look incredible in boom times, and terribly low in downturns. ROCE is only a point-in-time measure. How cyclical is S.A.S. Dragon Holdings? You can see for yourself by looking at this free graph of past earnings, revenue and cash flow.
S.A.S. Dragon Holdings's Current Liabilities And Their Impact On Its ROCE
Current liabilities include invoices, such as supplier payments, short-term debt, or a tax bill, that need to be paid within 12 months. The ROCE equation subtracts current liabilities from capital employed, so a company with a lot of current liabilities appears to have less capital employed, and a higher ROCE than otherwise. To check the impact of this, we calculate if a company has high current liabilities relative to its total assets.
S.A.S. Dragon Holdings has total assets of HK$6.6b and current liabilities of HK$4.6b. As a result, its current liabilities are equal to approximately 69% of its total assets. S.A.S. Dragon Holdings boasts an attractive ROCE, even after considering the boost from high current liabilities.
The Bottom Line On S.A.S. Dragon Holdings's ROCE
In my book, this business could be worthy of further research. There might be better investments than S.A.S. Dragon Holdings out there, but you will have to work hard to find them . These promising businesses with rapidly growing earnings might be right up your alley.
If you like to buy stocks alongside management, then you might just love this free list of companies. (Hint: insiders have been buying them).
We aim to bring you long-term focused research analysis driven by fundamental data. Note that our analysis may not factor in the latest price-sensitive company announcements or qualitative material.
If you spot an error that warrants correction, please contact the editor at editorial-team@simplywallst.com. This article by Simply Wall St is general in nature. It does not constitute a recommendation to buy or sell any stock, and does not take account of your objectives, or your financial situation. Simply Wall St has no position in the stocks mentioned. Thank you for reading.

