A Close Look At Genting Singapore Limited’s (SGX:G13) 10% ROCE

Today we'll evaluate Genting Singapore Limited (SGX:G13) to determine whether it could have potential as an investment idea. Specifically, we're going to calculate its Return On Capital Employed (ROCE), in the hopes of getting some insight into the business.
First, we'll go over how we calculate ROCE. Next, we'll compare it to others in its industry. Finally, we'll look at how its current liabilities affect its ROCE.
What is Return On Capital Employed (ROCE)?
ROCE measures the amount of pre-tax profits a company can generate from the capital employed in its business. All else being equal, a better business will have a higher ROCE. Ultimately, it is a useful but imperfect metric. Renowned investment researcher Michael Mauboussin has suggested that a high ROCE can indicate that 'one dollar invested in the company generates value of more than one dollar'.
How Do You Calculate Return On Capital Employed?
Analysts use this formula to calculate return on capital employed:
Return on Capital Employed = Earnings Before Interest and Tax (EBIT) ÷ (Total Assets - Current Liabilities)
Or for Genting Singapore:
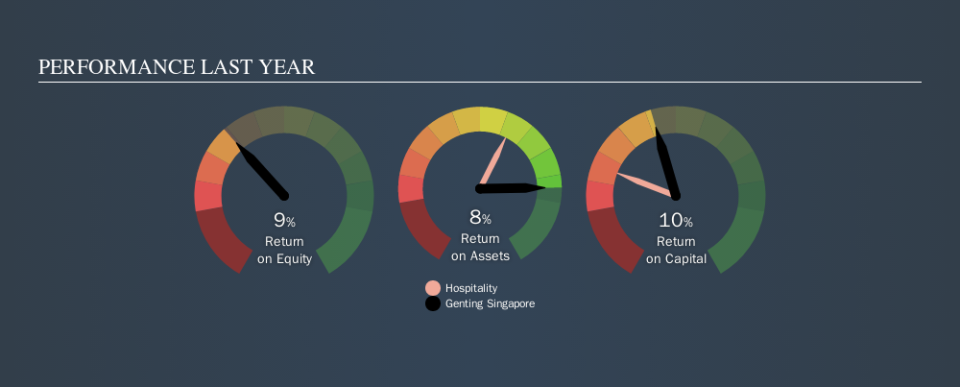
0.10 = S$850m ÷ (S$9.1b - S$626m) (Based on the trailing twelve months to June 2019.)
Therefore, Genting Singapore has an ROCE of 10%.
View our latest analysis for Genting Singapore
Is Genting Singapore's ROCE Good?
ROCE can be useful when making comparisons, such as between similar companies. Using our data, we find that Genting Singapore's ROCE is meaningfully better than the 7.4% average in the Hospitality industry. We consider this a positive sign, because it suggests it uses capital more efficiently than similar companies. Aside from the industry comparison, Genting Singapore's ROCE is mediocre in absolute terms, considering the risk of investing in stocks versus the safety of a bank account. It is possible that there are more rewarding investments out there.
In our analysis, Genting Singapore's ROCE appears to be 10%, compared to 3 years ago, when its ROCE was 3.7%. This makes us think about whether the company has been reinvesting shrewdly. The image below shows how Genting Singapore's ROCE compares to its industry, and you can click it to see more detail on its past growth.
When considering this metric, keep in mind that it is backwards looking, and not necessarily predictive. ROCE can be misleading for companies in cyclical industries, with returns looking impressive during the boom times, but very weak during the busts. ROCE is only a point-in-time measure. Future performance is what matters, and you can see analyst predictions in our free report on analyst forecasts for the company.
Genting Singapore's Current Liabilities And Their Impact On Its ROCE
Current liabilities are short term bills and invoices that need to be paid in 12 months or less. Due to the way ROCE is calculated, a high level of current liabilities makes a company look as though it has less capital employed, and thus can (sometimes unfairly) boost the ROCE. To counter this, investors can check if a company has high current liabilities relative to total assets.
Genting Singapore has total assets of S$9.1b and current liabilities of S$626m. As a result, its current liabilities are equal to approximately 6.9% of its total assets. Genting Singapore reports few current liabilities, which have a negligible impact on its unremarkable ROCE.
What We Can Learn From Genting Singapore's ROCE
If performance improves, then Genting Singapore may be an OK investment, especially at the right valuation. But note: make sure you look for a great company, not just the first idea you come across. So take a peek at this free list of interesting companies with strong recent earnings growth (and a P/E ratio below 20).
For those who like to find winning investments this free list of growing companies with recent insider purchasing, could be just the ticket.
We aim to bring you long-term focused research analysis driven by fundamental data. Note that our analysis may not factor in the latest price-sensitive company announcements or qualitative material.
If you spot an error that warrants correction, please contact the editor at editorial-team@simplywallst.com. This article by Simply Wall St is general in nature. It does not constitute a recommendation to buy or sell any stock, and does not take account of your objectives, or your financial situation. Simply Wall St has no position in the stocks mentioned. Thank you for reading.
