A Close Look At Uttam Sugar Mills Limited’s (NSE:UTTAMSUGAR) 25% ROCE

Want to participate in a short research study? Help shape the future of investing tools and you could win a $250 gift card!
Today we'll evaluate Uttam Sugar Mills Limited (NSE:UTTAMSUGAR) to determine whether it could have potential as an investment idea. In particular, we'll consider its Return On Capital Employed (ROCE), as that can give us insight into how profitably the company is able to employ capital in its business.
First of all, we'll work out how to calculate ROCE. Next, we'll compare it to others in its industry. Then we'll determine how its current liabilities are affecting its ROCE.
Understanding Return On Capital Employed (ROCE)
ROCE measures the amount of pre-tax profits a company can generate from the capital employed in its business. Generally speaking a higher ROCE is better. Overall, it is a valuable metric that has its flaws. Author Edwin Whiting says to be careful when comparing the ROCE of different businesses, since 'No two businesses are exactly alike.'
So, How Do We Calculate ROCE?
The formula for calculating the return on capital employed is:
Return on Capital Employed = Earnings Before Interest and Tax (EBIT) ÷ (Total Assets - Current Liabilities)
Or for Uttam Sugar Mills:
0.25 = ₹1.5b ÷ (₹17b - ₹12b) (Based on the trailing twelve months to March 2019.)
So, Uttam Sugar Mills has an ROCE of 25%.
View our latest analysis for Uttam Sugar Mills
Does Uttam Sugar Mills Have A Good ROCE?
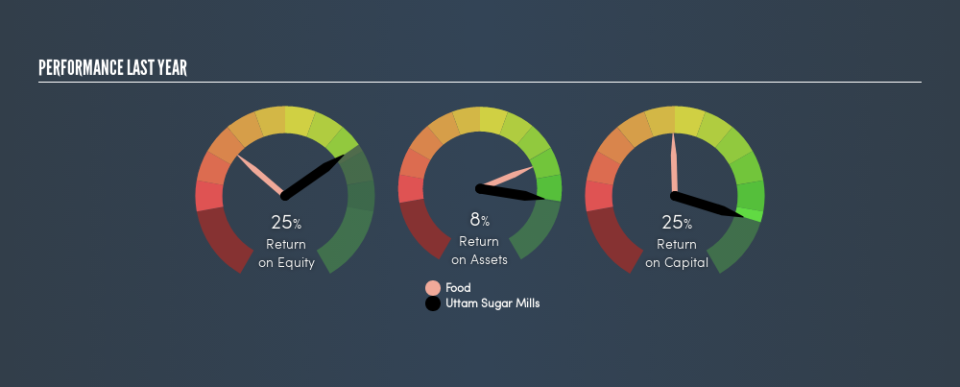
One way to assess ROCE is to compare similar companies. Using our data, we find that Uttam Sugar Mills's ROCE is meaningfully better than the 12% average in the Food industry. We consider this a positive sign, because it suggests it uses capital more efficiently than similar companies. Regardless of where Uttam Sugar Mills sits next to its industry, its ROCE in absolute terms appears satisfactory, and this company could be worth a closer look.
We can see that , Uttam Sugar Mills currently has an ROCE of 25% compared to its ROCE 3 years ago, which was 12%. This makes us think the business might be improving. You can see in the image below how Uttam Sugar Mills's ROCE compares to its industry. Click to see more on past growth.
When considering ROCE, bear in mind that it reflects the past and does not necessarily predict the future. ROCE can be misleading for companies in cyclical industries, with returns looking impressive during the boom times, but very weak during the busts. This is because ROCE only looks at one year, instead of considering returns across a whole cycle. How cyclical is Uttam Sugar Mills? You can see for yourself by looking at this free graph of past earnings, revenue and cash flow.
Do Uttam Sugar Mills's Current Liabilities Skew Its ROCE?
Liabilities, such as supplier bills and bank overdrafts, are referred to as current liabilities if they need to be paid within 12 months. Due to the way ROCE is calculated, a high level of current liabilities makes a company look as though it has less capital employed, and thus can (sometimes unfairly) boost the ROCE. To counteract this, we check if a company has high current liabilities, relative to its total assets.
Uttam Sugar Mills has total assets of ₹17b and current liabilities of ₹12b. As a result, its current liabilities are equal to approximately 66% of its total assets. Uttam Sugar Mills's current liabilities are fairly high, which increases its ROCE significantly.
Our Take On Uttam Sugar Mills's ROCE
This ROCE is pretty good, but remember that it would look less impressive with fewer current liabilities. There might be better investments than Uttam Sugar Mills out there, but you will have to work hard to find them . These promising businesses with rapidly growing earnings might be right up your alley.
If you are like me, then you will not want to miss this free list of growing companies that insiders are buying.
We aim to bring you long-term focused research analysis driven by fundamental data. Note that our analysis may not factor in the latest price-sensitive company announcements or qualitative material.
If you spot an error that warrants correction, please contact the editor at editorial-team@simplywallst.com. This article by Simply Wall St is general in nature. It does not constitute a recommendation to buy or sell any stock, and does not take account of your objectives, or your financial situation. Simply Wall St has no position in the stocks mentioned. Thank you for reading.
