A Closer Look At Crystal International Group Limited's (HKG:2232) Impressive ROE

Many investors are still learning about the various metrics that can be useful when analysing a stock. This article is for those who would like to learn about Return On Equity (ROE). By way of learning-by-doing, we'll look at ROE to gain a better understanding of Crystal International Group Limited (HKG:2232).
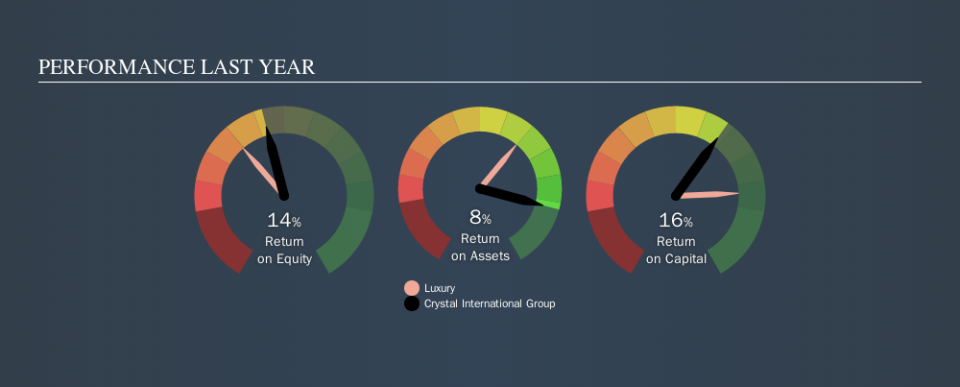
Our data shows Crystal International Group has a return on equity of 14% for the last year. Another way to think of that is that for every HK$1 worth of equity in the company, it was able to earn HK$0.14.
View our latest analysis for Crystal International Group
How Do I Calculate ROE?
The formula for return on equity is:
Return on Equity = Net Profit ÷ Shareholders' Equity
Or for Crystal International Group:
14% = US$139m ÷ US$1.0b (Based on the trailing twelve months to June 2019.)
It's easy to understand the 'net profit' part of that equation, but 'shareholders' equity' requires further explanation. It is all the money paid into the company from shareholders, plus any earnings retained. Shareholders' equity can be calculated by subtracting the total liabilities of the company from the total assets of the company.
What Does ROE Mean?
ROE measures a company's profitability against the profit it retains, and any outside investments. The 'return' is the profit over the last twelve months. The higher the ROE, the more profit the company is making. So, all else equal, investors should like a high ROE. That means ROE can be used to compare two businesses.
Does Crystal International Group Have A Good ROE?
Arguably the easiest way to assess company's ROE is to compare it with the average in its industry. Importantly, this is far from a perfect measure, because companies differ significantly within the same industry classification. As you can see in the graphic below, Crystal International Group has a higher ROE than the average (9.5%) in the Luxury industry.
That's clearly a positive. I usually take a closer look when a company has a better ROE than industry peers. For example, I often check if insiders have been buying shares .
How Does Debt Impact ROE?
Most companies need money -- from somewhere -- to grow their profits. That cash can come from issuing shares, retained earnings, or debt. In the first and second cases, the ROE will reflect this use of cash for investment in the business. In the latter case, the debt required for growth will boost returns, but will not impact the shareholders' equity. In this manner the use of debt will boost ROE, even though the core economics of the business stay the same.
Crystal International Group's Debt And Its 14% ROE
While Crystal International Group does have some debt, with debt to equity of just 0.39, we wouldn't say debt is excessive. The fact that it achieved a fairly good ROE with only modest debt suggests the business might be worth putting on your watchlist. Conservative use of debt to boost returns is usually a good move for shareholders, though it does leave the company more exposed to interest rate rises.
In Summary
Return on equity is useful for comparing the quality of different businesses. A company that can achieve a high return on equity without debt could be considered a high quality business. If two companies have around the same level of debt to equity, and one has a higher ROE, I'd generally prefer the one with higher ROE.
But ROE is just one piece of a bigger puzzle, since high quality businesses often trade on high multiples of earnings. It is important to consider other factors, such as future profit growth -- and how much investment is required going forward. So I think it may be worth checking this free report on analyst forecasts for the company.
Of course Crystal International Group may not be the best stock to buy. So you may wish to see this free collection of other companies that have high ROE and low debt.
We aim to bring you long-term focused research analysis driven by fundamental data. Note that our analysis may not factor in the latest price-sensitive company announcements or qualitative material.
If you spot an error that warrants correction, please contact the editor at editorial-team@simplywallst.com. This article by Simply Wall St is general in nature. It does not constitute a recommendation to buy or sell any stock, and does not take account of your objectives, or your financial situation. Simply Wall St has no position in the stocks mentioned. Thank you for reading.
