What Is CMON's (HKG:8278) P/E Ratio After Its Share Price Rocketed?

CMON (HKG:8278) shareholders are no doubt pleased to see that the share price has had a great month, posting a 32% gain, recovering from prior weakness. But shareholders may not all be feeling jubilant, since the share price is still down 15% in the last year.
Assuming no other changes, a sharply higher share price makes a stock less attractive to potential buyers. In the long term, share prices tend to follow earnings per share, but in the short term prices bounce around in response to short term factors (which are not always obvious). So some would prefer to hold off buying when there is a lot of optimism towards a stock. Perhaps the simplest way to get a read on investors' expectations of a business is to look at its Price to Earnings Ratio (PE Ratio). A high P/E ratio means that investors have a high expectation about future growth, while a low P/E ratio means they have low expectations about future growth.
See our latest analysis for CMON
How Does CMON's P/E Ratio Compare To Its Peers?
CMON's P/E of 33.15 indicates some degree of optimism towards the stock. You can see in the image below that the average P/E (10.5) for companies in the leisure industry is a lot lower than CMON's P/E.
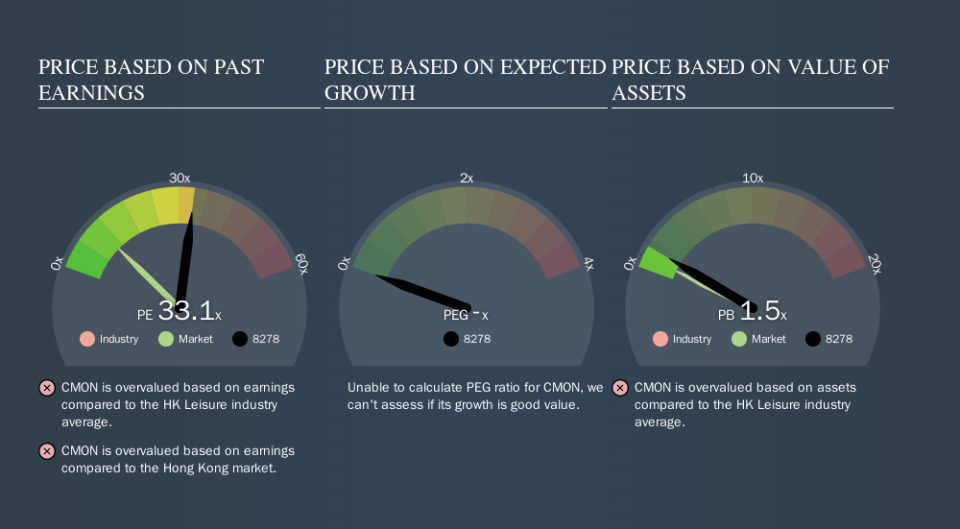
That means that the market expects CMON will outperform other companies in its industry. Shareholders are clearly optimistic, but the future is always uncertain. So investors should delve deeper. I like to check if company insiders have been buying or selling.
How Growth Rates Impact P/E Ratios
Companies that shrink earnings per share quickly will rapidly decrease the 'E' in the equation. That means unless the share price falls, the P/E will increase in a few years. So while a stock may look cheap based on past earnings, it could be expensive based on future earnings.
CMON saw earnings per share decrease by 70% last year. And over the longer term (5 years) earnings per share have decreased 22% annually. This might lead to muted expectations.
Remember: P/E Ratios Don't Consider The Balance Sheet
Don't forget that the P/E ratio considers market capitalization. So it won't reflect the advantage of cash, or disadvantage of debt. Theoretically, a business can improve its earnings (and produce a lower P/E in the future) by investing in growth. That means taking on debt (or spending its cash).
Such expenditure might be good or bad, in the long term, but the point here is that the balance sheet is not reflected by this ratio.
Is Debt Impacting CMON's P/E?
CMON has net debt equal to 27% of its market cap. You'd want to be aware of this fact, but it doesn't bother us.
The Bottom Line On CMON's P/E Ratio
CMON trades on a P/E ratio of 33.1, which is multiples above its market average of 10.4. With some debt but no EPS growth last year, the market has high expectations of future profits. What we know for sure is that investors have become much more excited about CMON recently, since they have pushed its P/E ratio from 25.1 to 33.1 over the last month. For those who prefer to invest with the flow of momentum, that might mean it's time to put the stock on a watchlist, or research it. But the contrarian may see it as a missed opportunity.
Investors should be looking to buy stocks that the market is wrong about. If the reality for a company is better than it expects, you can make money by buying and holding for the long term. We don't have analyst forecasts, but you could get a better understanding of its growth by checking out this more detailed historical graph of earnings, revenue and cash flow.
But note: CMON may not be the best stock to buy. So take a peek at this free list of interesting companies with strong recent earnings growth (and a P/E ratio below 20).
We aim to bring you long-term focused research analysis driven by fundamental data. Note that our analysis may not factor in the latest price-sensitive company announcements or qualitative material.
If you spot an error that warrants correction, please contact the editor at editorial-team@simplywallst.com. This article by Simply Wall St is general in nature. It does not constitute a recommendation to buy or sell any stock, and does not take account of your objectives, or your financial situation. Simply Wall St has no position in the stocks mentioned. Thank you for reading.

