Is Cogobuy Group (HKG:400) Using Too Much Debt?

Some say volatility, rather than debt, is the best way to think about risk as an investor, but Warren Buffett famously said that 'Volatility is far from synonymous with risk. So it might be obvious that you need to consider debt, when you think about how risky any given stock is, because too much debt can sink a company. Importantly, Cogobuy Group (HKG:400) does carry debt. But should shareholders be worried about its use of debt?
When Is Debt A Problem?
Debt assists a business until the business has trouble paying it off, either with new capital or with free cash flow. In the worst case scenario, a company can go bankrupt if it cannot pay its creditors. However, a more common (but still painful) scenario is that it has to raise new equity capital at a low price, thus permanently diluting shareholders. Of course, debt can be an important tool in businesses, particularly capital heavy businesses. When we think about a company's use of debt, we first look at cash and debt together.
See our latest analysis for Cogobuy Group
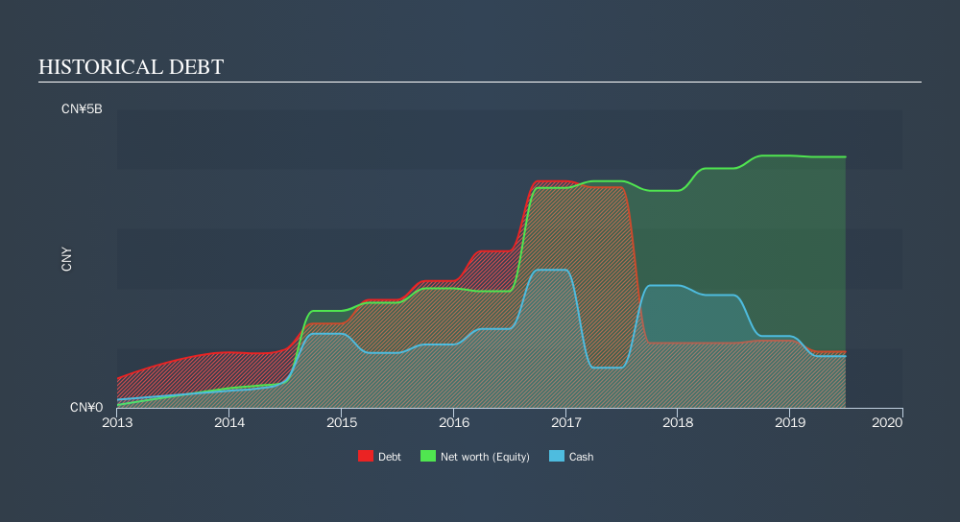
What Is Cogobuy Group's Debt?
As you can see below, Cogobuy Group had CN¥942.4m of debt at June 2019, down from CN¥1.09b a year prior. However, because it has a cash reserve of CN¥865.2m, its net debt is less, at about CN¥77.2m.
How Strong Is Cogobuy Group's Balance Sheet?
We can see from the most recent balance sheet that Cogobuy Group had liabilities of CN¥1.90b falling due within a year, and liabilities of CN¥64.4m due beyond that. On the other hand, it had cash of CN¥865.2m and CN¥2.49b worth of receivables due within a year. So it can boast CN¥1.39b more liquid assets than total liabilities.
This luscious liquidity implies that Cogobuy Group's balance sheet is sturdy like a giant sequoia tree. With this in mind one could posit that its balance sheet is as strong as beautiful a rare rhino.
We measure a company's debt load relative to its earnings power by looking at its net debt divided by its earnings before interest, tax, depreciation, and amortization (EBITDA) and by calculating how easily its earnings before interest and tax (EBIT) cover its interest expense (interest cover). This way, we consider both the absolute quantum of the debt, as well as the interest rates paid on it.
Cogobuy Group has a very low debt to EBITDA ratio of 0.73 so it is strange to see weak interest coverage, with last year's EBIT being only 2.4 times the interest expense. So one way or the other, it's clear the debt levels are not trivial. The bad news is that Cogobuy Group saw its EBIT decline by 20% over the last year. If earnings continue to decline at that rate then handling the debt will be more difficult than taking three children under 5 to a fancy pants restaurant. When analysing debt levels, the balance sheet is the obvious place to start. But it is future earnings, more than anything, that will determine Cogobuy Group's ability to maintain a healthy balance sheet going forward. So if you're focused on the future you can check out this free report showing analyst profit forecasts.
Finally, while the tax-man may adore accounting profits, lenders only accept cold hard cash. So the logical step is to look at the proportion of that EBIT that is matched by actual free cash flow. During the last three years, Cogobuy Group burned a lot of cash. While that may be a result of expenditure for growth, it does make the debt far more risky.
Our View
Cogobuy Group's conversion of EBIT to free cash flow and EBIT growth rate definitely weigh on it, in our esteem. But its level of total liabilities tells a very different story, and suggests some resilience. We think that Cogobuy Group's debt does make it a bit risky, after considering the aforementioned data points together. That's not necessarily a bad thing, since leverage can boost returns on equity, but it is something to be aware of. Over time, share prices tend to follow earnings per share, so if you're interested in Cogobuy Group, you may well want to click here to check an interactive graph of its earnings per share history.
If, after all that, you're more interested in a fast growing company with a rock-solid balance sheet, then check out our list of net cash growth stocks without delay.
We aim to bring you long-term focused research analysis driven by fundamental data. Note that our analysis may not factor in the latest price-sensitive company announcements or qualitative material.
If you spot an error that warrants correction, please contact the editor at editorial-team@simplywallst.com. This article by Simply Wall St is general in nature. It does not constitute a recommendation to buy or sell any stock, and does not take account of your objectives, or your financial situation. Simply Wall St has no position in the stocks mentioned. Thank you for reading.

