Do You Like Community Trust Bancorp, Inc. (NASDAQ:CTBI) At This P/E Ratio?

Want to participate in a short research study? Help shape the future of investing tools and you could win a $250 gift card!
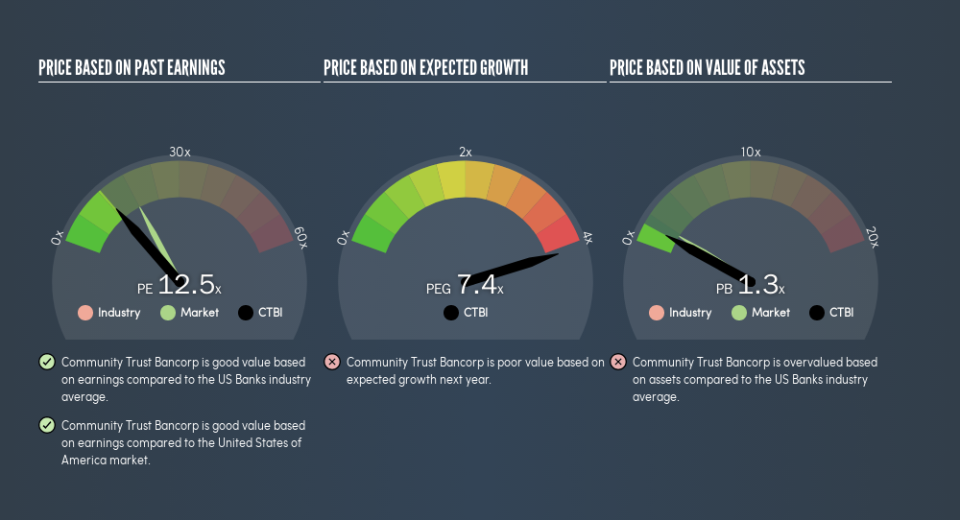
The goal of this article is to teach you how to use price to earnings ratios (P/E ratios). We'll apply a basic P/E ratio analysis to Community Trust Bancorp, Inc.'s (NASDAQ:CTBI), to help you decide if the stock is worth further research. Community Trust Bancorp has a price to earnings ratio of 12.52, based on the last twelve months. That corresponds to an earnings yield of approximately 8.0%.
Check out our latest analysis for Community Trust Bancorp
How Do You Calculate A P/E Ratio?
The formula for P/E is:
Price to Earnings Ratio = Share Price ÷ Earnings per Share (EPS)
Or for Community Trust Bancorp:
P/E of 12.52 = $41.28 ÷ $3.3 (Based on the year to March 2019.)
Is A High Price-to-Earnings Ratio Good?
A higher P/E ratio means that investors are paying a higher price for each $1 of company earnings. That is not a good or a bad thing per se, but a high P/E does imply buyers are optimistic about the future.
Does Community Trust Bancorp Have A Relatively High Or Low P/E For Its Industry?
The P/E ratio essentially measures market expectations of a company. As you can see below Community Trust Bancorp has a P/E ratio that is fairly close for the average for the banks industry, which is 12.8.
That indicates that the market expects Community Trust Bancorp will perform roughly in line with other companies in its industry. If the company has better than average prospects, then the market might be underestimating it. Further research into factors such as insider buying and selling, could help you form your own view on whether that is likely.
How Growth Rates Impact P/E Ratios
Generally speaking the rate of earnings growth has a profound impact on a company's P/E multiple. If earnings are growing quickly, then the 'E' in the equation will increase faster than it would otherwise. And in that case, the P/E ratio itself will drop rather quickly. So while a stock may look expensive based on past earnings, it could be cheap based on future earnings.
Community Trust Bancorp increased earnings per share by 3.8% last year. And earnings per share have improved by 5.5% annually, over the last five years.
A Limitation: P/E Ratios Ignore Debt and Cash In The Bank
Don't forget that the P/E ratio considers market capitalization. So it won't reflect the advantage of cash, or disadvantage of debt. The exact same company would hypothetically deserve a higher P/E ratio if it had a strong balance sheet, than if it had a weak one with lots of debt, because a cashed up company can spend on growth.
Spending on growth might be good or bad a few years later, but the point is that the P/E ratio does not account for the option (or lack thereof).
So What Does Community Trust Bancorp's Balance Sheet Tell Us?
Community Trust Bancorp's net debt equates to 33% of its market capitalization. While it's worth keeping this in mind, it isn't a worry.
The Verdict On Community Trust Bancorp's P/E Ratio
Community Trust Bancorp's P/E is 12.5 which is below average (17.9) in the US market. EPS grew over the last twelve months, and debt levels are quite reasonable. If growth is sustainable over the long term, then the current P/E ratio may be a sign of good value.
Investors should be looking to buy stocks that the market is wrong about. If it is underestimating a company, investors can make money by buying and holding the shares until the market corrects itself. So this free visualization of the analyst consensus on future earnings could help you make the right decision about whether to buy, sell, or hold.
But note: Community Trust Bancorp may not be the best stock to buy. So take a peek at this free list of interesting companies with strong recent earnings growth (and a P/E ratio below 20).
We aim to bring you long-term focused research analysis driven by fundamental data. Note that our analysis may not factor in the latest price-sensitive company announcements or qualitative material.
If you spot an error that warrants correction, please contact the editor at editorial-team@simplywallst.com. This article by Simply Wall St is general in nature. It does not constitute a recommendation to buy or sell any stock, and does not take account of your objectives, or your financial situation. Simply Wall St has no position in the stocks mentioned. Thank you for reading.

