The Complexity of Amazon.com, Inc.'s (NASDAQ:AMZN) Business Masks Improving Profitability
This article first appeared on Simply Wall St News .
Amazon.com's (NASDAQ:AMZN) second quarter results clearly disappointed the market when they were released last week. The stock opened 7 percent lower on Friday and remains nearly 12 percent below the record high it reached two weeks ago. While quarterly EPS beat estimates, reported revenue was $2 billion less than expected. However, it was the guidance that really spooked the market. Amazon warned that top line growth is expected to fall to between 10 and 16% in the third quarter, and that slower growth may continue for several quarters.
Long time Amazon investors know that the company often guides for lower EPS during periods of extensive investment. Revenue growth has also been quite cyclical in the past. Another aspect of Amazon’s business that is becoming increasingly apparent is its complexity.
Amazon is now far more than an online retailer. The various business segments are all growing at different rates, and have very different margins. The following table illustrates just how different the three main business segments are.
% Of Net Sales | YoY Growth | Operating Margin | |
North America | 60% | 22% | 5% |
International | 27% | 36% | 1% |
AWS (Cloud) | 13% | 37% | 28% |
Total | 100% | 24% | 7% |
Amazon's Net Sales by Business Segment, Q2 2021 ( Source: SEC Filing )
The next table splits Amazon's net sales for the second quarter by product and service type. We can see that year on year growth rates for the quarter ranged from 11% for physical stores to 87% for advertising.
% Of Net Sales | YoY Growth | |
Online stores | 47% | 16% |
Physical stores | 4% | 11% |
Third-party seller services | 22% | 38% |
Subscription services | 7% | 32% |
Other (Mostly advertising) | 7% | 87% |
AWS | 13% | 37% |
Total | 100% | 27% |
Amazon's Net Sales by Products and Services, Q2 2021 ( Source: SEC Filing )
The complexity of all these business segments can make it quite difficult to assess how well Amazon is actually doing. In addition, Amazon reinvests so much of its cash flow that at times it doesn't appear as profitable as it really is.
One way to get a better sense of the company's profitability and efficiency is to look at Amazon's Return on Equity. Return on Equity or ROE is a test of how effectively a company is growing its value and managing investor's money. Simply put, it is used to assess the profitability of a company in relation to its equity capital. It can also help us determine how well a company is allocating capital over time.
View our latest analysis for Amazon.com
How Do You Calculate Return On Equity?
Return on equity can be calculated by using the formula:
Return on Equity = Net Profit (from continuing operations) ÷ Shareholders' Equity
So, based on the above formula, the ROE for Amazon.com is:
26% = US$29b ÷ US$115b (Based on the trailing twelve months to June 2021).
The 'return' is the yearly profit. That means that for every $1 worth of shareholders' equity, the company generated $0.26 in profit.
What Is The Relationship Between ROE And Earnings Growth?
So far, we've learned that ROE is a measure of a company's profitability. We now need to evaluate how much profit the company reinvests or "retains" for future growth which then gives us an idea about the growth potential of the company. Assuming all else is equal, companies that have both a higher return on equity and higher profit retention are usually the ones that have a higher growth rate when compared to companies that don't have the same features.
Amazon.com's Earnings Growth And 26% ROE
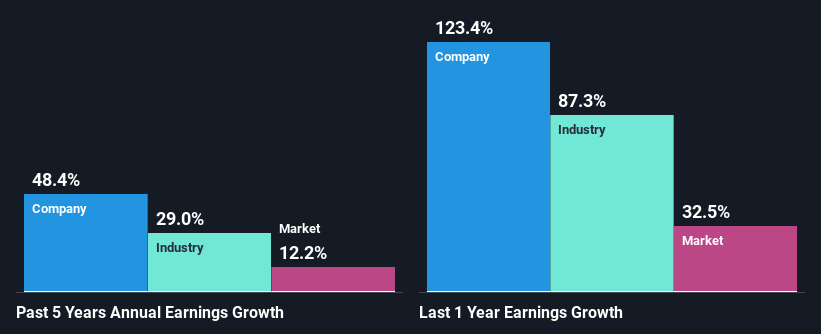
Firstly, we acknowledge that Amazon.com has a significantly high ROE. Secondly, even when compared to the industry average of 19% the company's ROE is quite impressive. As a result, Amazon.com's exceptional 48% net income growth seen over the past five years, doesn't come as a surprise.
We then compared Amazon.com's net income growth with the industry and we're pleased to see that the company's growth figure is higher when compared with the industry which has a growth rate of 29% in the same period.
Earnings growth is a huge factor in stock valuation.What investors need to determine next is if the expected earnings growth, or the lack of it, is already built into the share price. This then helps them determine if the stock is placed for a bright or bleak future. Is AMZN fairly valued? This infographic on the company's intrinsic value has everything you need to know.
Amazon.com is Reinvesting Retained Earnings Very Effectively
Amazon is well known for reinvesting it's earnings into further growth, both by building new infrastructure for the retail business and by investing in new businesses. This means earnings do not always increase steadily. However, Amazon has invested in businesses like Amazon Web Services and the advertising business that are improving the margins for the entire business. This has resulted in the ROE improving from just 4% in 2015 to 26% over the last 12 months.
The company has warned that revenue growth is likely to slow down in the next few quarters. The good news is that the company's ROE is improving which may offset some of that slowdown in revenue growth.
To know more about the company's future earnings growth forecasts take a look at this free report on analyst forecasts for the company to find out more.
Simply Wall St analyst Richard Bowman and Simply Wall St have no position in any of the companies mentioned. This article is general in nature. It does not constitute a recommendation to buy or sell any stock and does not take account of your objectives, or your financial situation. We aim to bring you long-term focused analysis driven by fundamental data. Note that our analysis may not factor in the latest price-sensitive company announcements or qualitative material.
Have feedback on this article? Concerned about the content? Get in touch with us directly. Alternatively, email editorial-team@simplywallst.com


