Should You Be Concerned About Chembio Diagnostics, Inc.'s (NASDAQ:CEMI) Historical Volatility?

Want to participate in a short research study? Help shape the future of investing tools and you could win a $250 gift card!
Anyone researching Chembio Diagnostics, Inc. (NASDAQ:CEMI) might want to consider the historical volatility of the share price. Volatility is considered to be a measure of risk in modern finance theory. Investors may think of volatility as falling into two main categories. First, we have company specific volatility, which is the price gyrations of an individual stock. Holding at least 8 stocks can reduce this kind of risk across a portfolio. The second type is the broader market volatility, which you cannot diversify away, since it arises from macroeconomic factors which directly affects all the stocks on the market.
Some stocks mimic the volatility of the market quite closely, while others demonstrate muted, exagerrated or uncorrelated price movements. Beta can be a useful tool to understand how much a stock is influenced by market risk (volatility). However, Warren Buffett said 'volatility is far from synonymous with risk' in his 2014 letter to investors. So, while useful, beta is not the only metric to consider. To use beta as an investor, you must first understand that the overall market has a beta of one. Any stock with a beta of greater than one is considered more volatile than the market, while those with a beta below one are either less volatile or poorly correlated with the market.
View our latest analysis for Chembio Diagnostics
What we can learn from CEMI's beta value
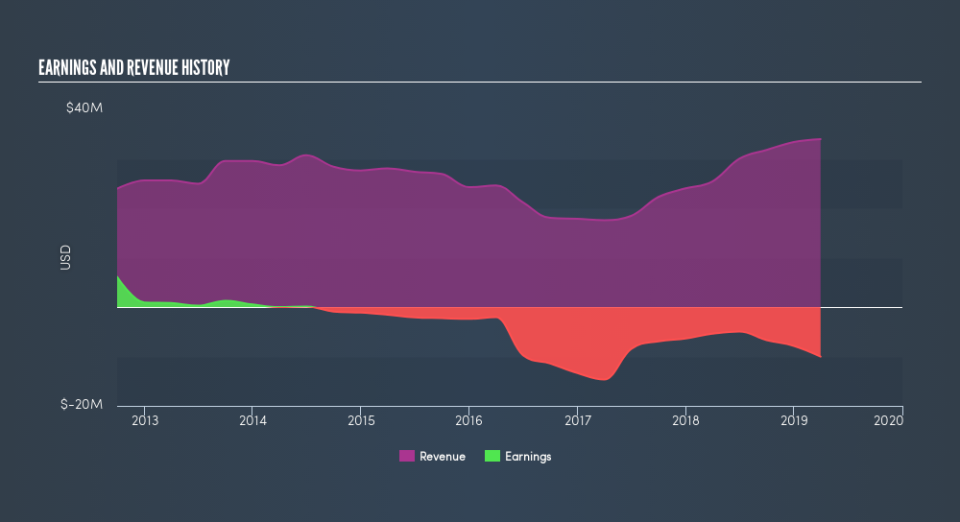
Zooming in on Chembio Diagnostics, we see it has a five year beta of 1.65. This is above 1, so historically its share price has been influenced by the broader volatility of the stock market. Based on this history, investors should be aware that Chembio Diagnostics are likely to rise strongly in times of greed, but sell off in times of fear. Share price volatility is well worth considering, but most long term investors consider the history of revenue and earnings growth to be more important. Take a look at how Chembio Diagnostics fares in that regard, below.
Could CEMI's size cause it to be more volatile?
Chembio Diagnostics is a rather small company. It has a market capitalisation of US$98m, which means it is probably under the radar of most investors. It has a relatively high beta, suggesting it is fairly actively traded for a company of its size. Because it takes less capital to move the share price of a small company like this, when a stock this size is actively traded it is quite often more sensitive to market volatility than similar large companies.
What this means for you:
Beta only tells us that the Chembio Diagnostics share price is sensitive to broader market movements. This could indicate that it is a high growth company, or is heavily influenced by sentiment because it is speculative. Alternatively, it could have operating leverage in its business model. Ultimately, beta is an interesting metric, but there's plenty more to learn. In order to fully understand whether CEMI is a good investment for you, we also need to consider important company-specific fundamentals such as Chembio Diagnostics’s financial health and performance track record. I highly recommend you dive deeper by considering the following:
Future Outlook: What are well-informed industry analysts predicting for CEMI’s future growth? Take a look at our free research report of analyst consensus for CEMI’s outlook.
Past Track Record: Has CEMI been consistently performing well irrespective of the ups and downs in the market? Go into more detail in the past performance analysis and take a look at the free visual representations of CEMI's historicals for more clarity.
Other Interesting Stocks: It's worth checking to see how CEMI measures up against other companies on valuation. You could start with this free list of prospective options.
We aim to bring you long-term focused research analysis driven by fundamental data. Note that our analysis may not factor in the latest price-sensitive company announcements or qualitative material.
If you spot an error that warrants correction, please contact the editor at editorial-team@simplywallst.com. This article by Simply Wall St is general in nature. It does not constitute a recommendation to buy or sell any stock, and does not take account of your objectives, or your financial situation. Simply Wall St has no position in the stocks mentioned. Thank you for reading.

