Is Control Print Limited's (NSE:CONTROLPR) High P/E Ratio A Problem For Investors?

Want to participate in a short research study? Help shape the future of investing tools and you could win a $250 gift card!
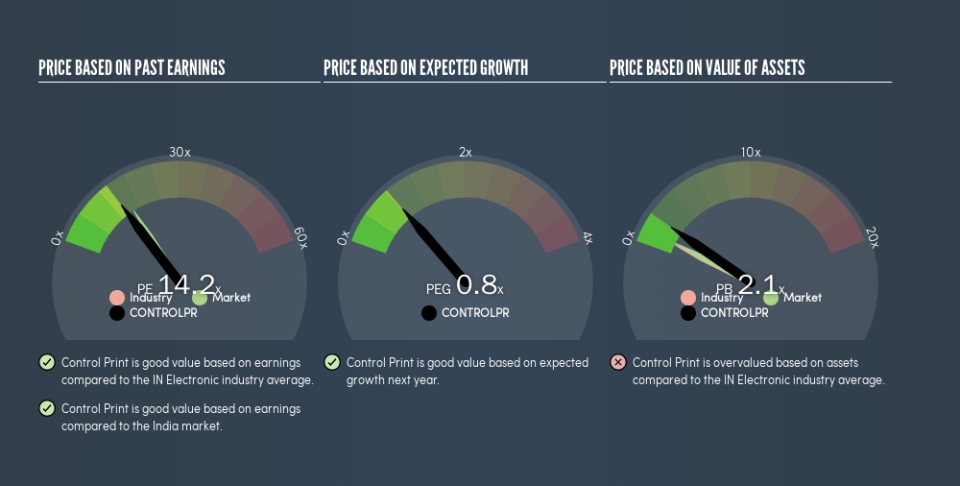
This article is written for those who want to get better at using price to earnings ratios (P/E ratios). We'll apply a basic P/E ratio analysis to Control Print Limited's (NSE:CONTROLPR), to help you decide if the stock is worth further research. Based on the last twelve months, Control Print's P/E ratio is 14.17. That is equivalent to an earnings yield of about 7.1%.
See our latest analysis for Control Print
How Do I Calculate A Price To Earnings Ratio?
The formula for P/E is:
Price to Earnings Ratio = Share Price ÷ Earnings per Share (EPS)
Or for Control Print:
P/E of 14.17 = ₹257.95 ÷ ₹18.21 (Based on the year to March 2019.)
Is A High P/E Ratio Good?
A higher P/E ratio implies that investors pay a higher price for the earning power of the business. That isn't necessarily good or bad, but a high P/E implies relatively high expectations of what a company can achieve in the future.
How Growth Rates Impact P/E Ratios
Probably the most important factor in determining what P/E a company trades on is the earnings growth. Earnings growth means that in the future the 'E' will be higher. That means unless the share price increases, the P/E will reduce in a few years. And as that P/E ratio drops, the company will look cheap, unless its share price increases.
Control Print shrunk earnings per share by 8.0% last year. But EPS is up 12% over the last 5 years.
How Does Control Print's P/E Ratio Compare To Its Peers?
We can get an indication of market expectations by looking at the P/E ratio. You can see in the image below that the average P/E (14.2) for companies in the electronic industry is roughly the same as Control Print's P/E.
Its P/E ratio suggests that Control Print shareholders think that in the future it will perform about the same as other companies in its industry classification. If the company has better than average prospects, then the market might be underestimating it. Checking factors such as the tenure of the board and management could help you form your own view on if that will happen.
Remember: P/E Ratios Don't Consider The Balance Sheet
The 'Price' in P/E reflects the market capitalization of the company. So it won't reflect the advantage of cash, or disadvantage of debt. Hypothetically, a company could reduce its future P/E ratio by spending its cash (or taking on debt) to achieve higher earnings.
Such expenditure might be good or bad, in the long term, but the point here is that the balance sheet is not reflected by this ratio.
How Does Control Print's Debt Impact Its P/E Ratio?
Control Print has net cash of ₹463m. This is fairly high at 11% of its market capitalization. That might mean balance sheet strength is important to the business, but should also help push the P/E a bit higher than it would otherwise be.
The Verdict On Control Print's P/E Ratio
Control Print trades on a P/E ratio of 14.2, which is below the IN market average of 16. Falling earnings per share are likely to be keeping potential buyers away, the relatively strong balance sheet will allow the company time to invest in growth. If it achieves that, then there's real potential that the low P/E could eventually indicate undervaluation.
When the market is wrong about a stock, it gives savvy investors an opportunity. If it is underestimating a company, investors can make money by buying and holding the shares until the market corrects itself. So this free visualization of the analyst consensus on future earnings could help you make the right decision about whether to buy, sell, or hold.
Of course, you might find a fantastic investment by looking at a few good candidates. So take a peek at this free list of companies with modest (or no) debt, trading on a P/E below 20.
We aim to bring you long-term focused research analysis driven by fundamental data. Note that our analysis may not factor in the latest price-sensitive company announcements or qualitative material.
If you spot an error that warrants correction, please contact the editor at editorial-team@simplywallst.com. This article by Simply Wall St is general in nature. It does not constitute a recommendation to buy or sell any stock, and does not take account of your objectives, or your financial situation. Simply Wall St has no position in the stocks mentioned. Thank you for reading.
