Is COSCO SHIPPING Development Co., Ltd. (HKG:2866) Investing Effectively In Its Business?

Today we are going to look at COSCO SHIPPING Development Co., Ltd. (HKG:2866) to see whether it might be an attractive investment prospect. Specifically, we'll consider its Return On Capital Employed (ROCE), since that will give us an insight into how efficiently the business can generate profits from the capital it requires.
First, we'll go over how we calculate ROCE. Next, we'll compare it to others in its industry. Then we'll determine how its current liabilities are affecting its ROCE.
What is Return On Capital Employed (ROCE)?
ROCE is a metric for evaluating how much pre-tax income (in percentage terms) a company earns on the capital invested in its business. Generally speaking a higher ROCE is better. Ultimately, it is a useful but imperfect metric. Author Edwin Whiting says to be careful when comparing the ROCE of different businesses, since 'No two businesses are exactly alike.'
So, How Do We Calculate ROCE?
The formula for calculating the return on capital employed is:
Return on Capital Employed = Earnings Before Interest and Tax (EBIT) ÷ (Total Assets - Current Liabilities)
Or for COSCO SHIPPING Development:
0.029 = CN¥2.6b ÷ (CN¥139b - CN¥48b) (Based on the trailing twelve months to March 2019.)
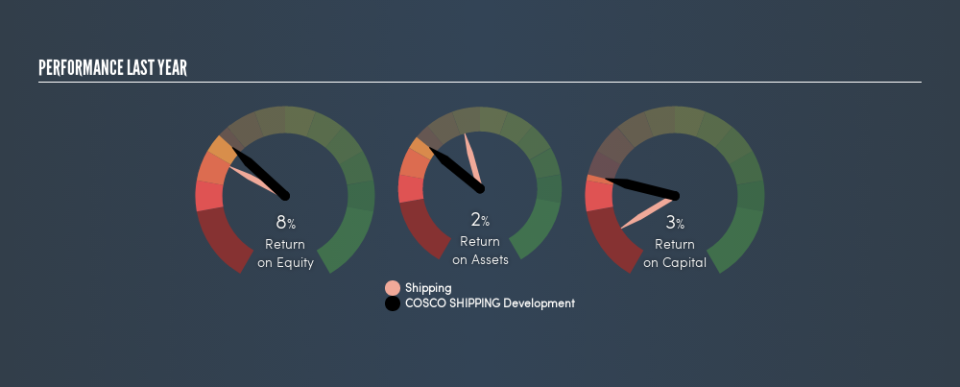
Therefore, COSCO SHIPPING Development has an ROCE of 2.9%.
Check out our latest analysis for COSCO SHIPPING Development
Is COSCO SHIPPING Development's ROCE Good?
When making comparisons between similar businesses, investors may find ROCE useful. It appears that COSCO SHIPPING Development's ROCE is fairly close to the Shipping industry average of 3.0%. Independently of how COSCO SHIPPING Development compares to its industry, its ROCE in absolute terms is low; especially compared to the ~2.0% available in government bonds. There are potentially more appealing investments elsewhere.
COSCO SHIPPING Development delivered an ROCE of 2.9%, which is better than 3 years ago, as was making losses back then. This makes us wonder if the company is improving. You can click on the image below to see (in greater detail) how COSCO SHIPPING Development's past growth compares to other companies.
Remember that this metric is backwards looking - it shows what has happened in the past, and does not accurately predict the future. Companies in cyclical industries can be difficult to understand using ROCE, as returns typically look high during boom times, and low during busts. ROCE is only a point-in-time measure. If COSCO SHIPPING Development is cyclical, it could make sense to check out this free graph of past earnings, revenue and cash flow.
Do COSCO SHIPPING Development's Current Liabilities Skew Its ROCE?
Current liabilities include invoices, such as supplier payments, short-term debt, or a tax bill, that need to be paid within 12 months. Due to the way ROCE is calculated, a high level of current liabilities makes a company look as though it has less capital employed, and thus can (sometimes unfairly) boost the ROCE. To check the impact of this, we calculate if a company has high current liabilities relative to its total assets.
COSCO SHIPPING Development has total liabilities of CN¥48b and total assets of CN¥139b. Therefore its current liabilities are equivalent to approximately 34% of its total assets. With a medium level of current liabilities boosting the ROCE a little, COSCO SHIPPING Development's low ROCE is unappealing.
Our Take On COSCO SHIPPING Development's ROCE
So researching other companies may be a better use of your time. You might be able to find a better investment than COSCO SHIPPING Development. If you want a selection of possible winners, check out this free list of interesting companies that trade on a P/E below 20 (but have proven they can grow earnings).
If you like to buy stocks alongside management, then you might just love this free list of companies. (Hint: insiders have been buying them).
We aim to bring you long-term focused research analysis driven by fundamental data. Note that our analysis may not factor in the latest price-sensitive company announcements or qualitative material.
If you spot an error that warrants correction, please contact the editor at editorial-team@simplywallst.com. This article by Simply Wall St is general in nature. It does not constitute a recommendation to buy or sell any stock, and does not take account of your objectives, or your financial situation. Simply Wall St has no position in the stocks mentioned. Thank you for reading.
