Could The China Fordoo Holdings Limited (HKG:2399) Ownership Structure Tell Us Something Useful?

If you want to know who really controls China Fordoo Holdings Limited (HKG:2399), then you'll have to look at the makeup of its share registry. Institutions often own shares in more established companies, while it's not unusual to see insiders own a fair bit of smaller companies. I quite like to see at least a little bit of insider ownership. As Charlie Munger said 'Show me the incentive and I will show you the outcome.
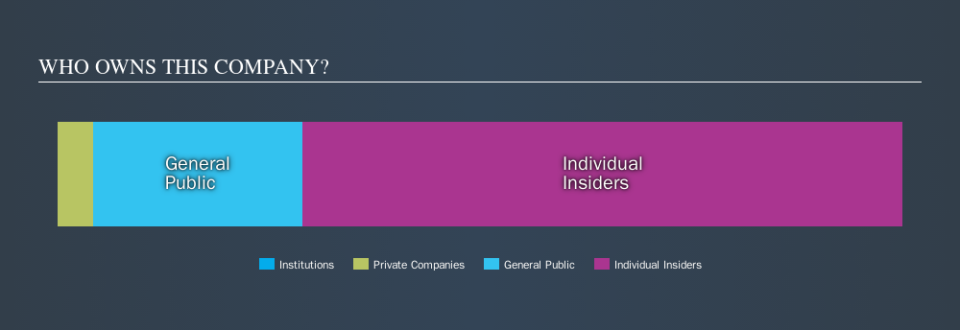
With a market capitalization of HK$4.3b, China Fordoo Holdings is a small cap stock, so it might not be well known by many institutional investors. In the chart below below, we can see that institutional investors have not yet purchased shares. Let's delve deeper into each type of owner, to discover more about 2399.
Check out our latest analysis for China Fordoo Holdings
What Does The Lack Of Institutional Ownership Tell Us About China Fordoo Holdings?
We don't tend to see institutional investors holding stock of companies that are very risky, thinly traded, or very small. Though we do sometimes see large companies without institutions on the register, it's not particularly common.
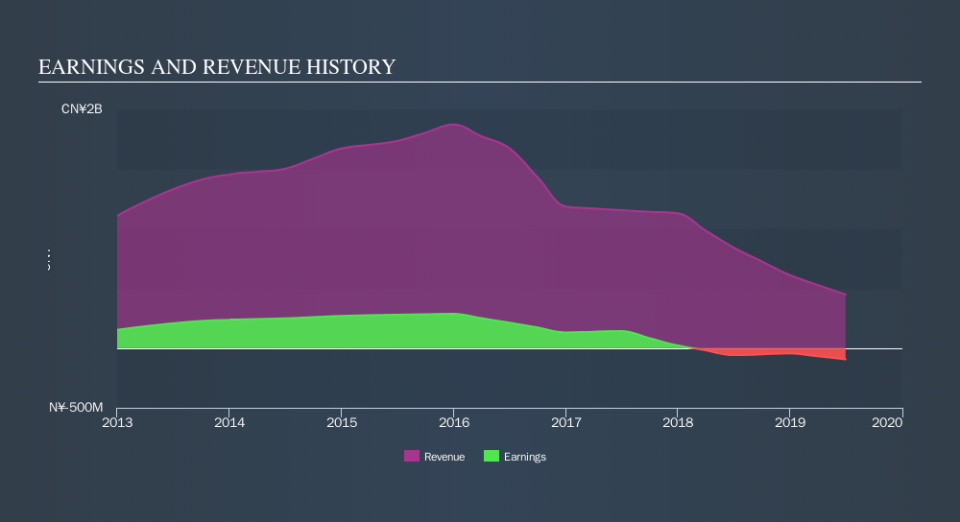
There are multiple explanations for why institutions don't own a stock. The most common is that the company is too small relative to fund under management, so the institition does not bother to look closely at the company. It is also possible that fund managers don't own the stock because they aren't convinced it will perform well. Institutional investors may not find the historic growth of the business impressive, or there might be other factors at play. You can see the past revenue performance of China Fordoo Holdings, for yourself, below.
China Fordoo Holdings is not owned by hedge funds. Our information suggests that there isn't any analyst coverage of the stock, so it is probably little known.
Insider Ownership Of China Fordoo Holdings
The definition of company insiders can be subjective, and does vary between jurisdictions. Our data reflects individual insiders, capturing board members at the very least. Management ultimately answers to the board. However, it is not uncommon for managers to be executive board members, especially if they are a founder or the CEO.
I generally consider insider ownership to be a good thing. However, on some occasions it makes it more difficult for other shareholders to hold the board accountable for decisions.
Our information suggests that insiders own more than half of China Fordoo Holdings Limited. This gives them effective control of the company. That means they own HK$3.1b worth of shares in the HK$4.3b company. That's quite meaningful. Most would argue this is a positive, showing strong alignment with shareholders. You can click here to see if those insiders have been buying or selling.
General Public Ownership
With a 25% ownership, the general public have some degree of sway over 2399. This size of ownership, while considerable, may not be enough to change company policy if the decision is not in sync with other large shareholders.
Private Company Ownership
We can see that Private Companies own 4.4%, of the shares on issue. It might be worth looking deeper into this. If related parties, such as insiders, have an interest in one of these private companies, that should be disclosed in the annual report. Private companies may also have a strategic interest in the company.
Next Steps:
While it is well worth considering the different groups that own a company, there are other factors that are even more important.
Many find it useful to take an in depth look at how a company has performed in the past. You can access this detailed graph of past earnings, revenue and cash flow.
Of course this may not be the best stock to buy. So take a peek at this free free list of interesting companies.
NB: Figures in this article are calculated using data from the last twelve months, which refer to the 12-month period ending on the last date of the month the financial statement is dated. This may not be consistent with full year annual report figures.
We aim to bring you long-term focused research analysis driven by fundamental data. Note that our analysis may not factor in the latest price-sensitive company announcements or qualitative material.
If you spot an error that warrants correction, please contact the editor at editorial-team@simplywallst.com. This article by Simply Wall St is general in nature. It does not constitute a recommendation to buy or sell any stock, and does not take account of your objectives, or your financial situation. Simply Wall St has no position in the stocks mentioned. Thank you for reading.
