Could Flexion Mobile Plc's (STO:FLEXM) Investor Composition Influence The Stock Price?

Every investor in Flexion Mobile Plc (STO:FLEXM) should be aware of the most powerful shareholder groups. Large companies usually have institutions as shareholders, and we usually see insiders owning shares in smaller companies. We also tend to see lower insider ownership in companies that were previously publicly owned.
Flexion Mobile is not a large company by global standards. It has a market capitalization of kr485m, which means it wouldn't have the attention of many institutional investors. In the chart below below, we can see that institutional investors have bought into the company. We can zoom in on the different ownership groups, to learn more about FLEXM.
See our latest analysis for Flexion Mobile
What Does The Institutional Ownership Tell Us About Flexion Mobile?
Many institutions measure their performance against an index that approximates the local market. So they usually pay more attention to companies that are included in major indices.
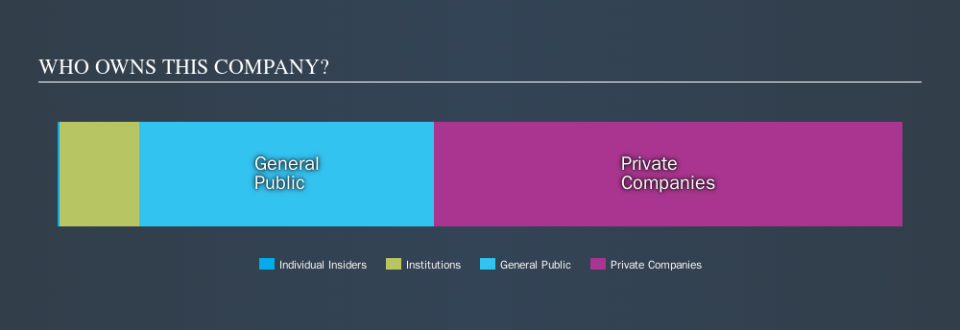
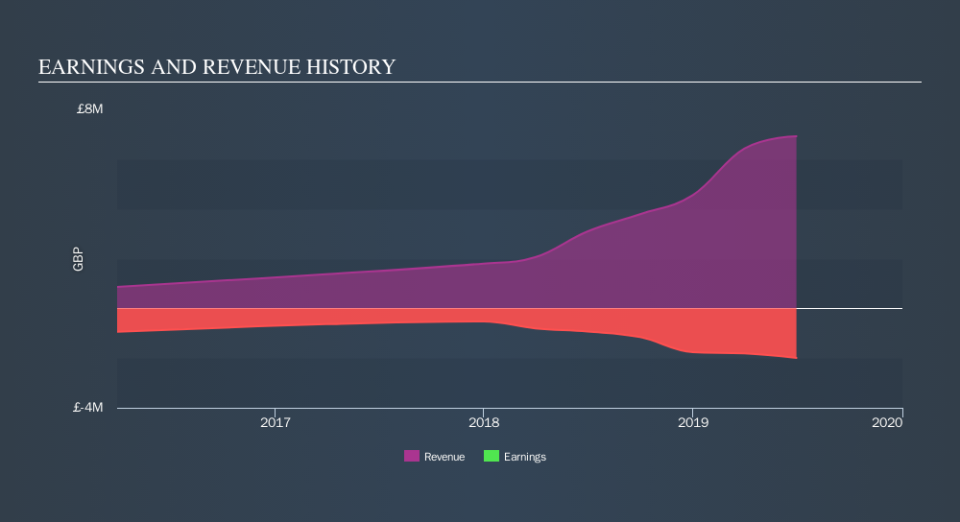
Flexion Mobile already has institutions on the share registry. Indeed, they own 9.5% of the company. This implies the analysts working for those institutions have looked at the stock and they like it. But just like anyone else, they could be wrong. If multiple institutions change their view on a stock at the same time, you could see the share price drop fast. It's therefore worth looking at Flexion Mobile's earnings history, below. Of course, the future is what really matters.
We note that hedge funds don't have a meaningful investment in Flexion Mobile. There is a little analyst coverage of the stock, but not much. So there is room for it to gain more coverage.
Insider Ownership Of Flexion Mobile
The definition of company insiders can be subjective, and does vary between jurisdictions. Our data reflects individual insiders, capturing board members at the very least. The company management answer to the board; and the latter should represent the interests of shareholders. Notably, sometimes top-level managers are on the board, themselves.
Insider ownership is positive when it signals leadership are thinking like the true owners of the company. However, high insider ownership can also give immense power to a small group within the company. This can be negative in some circumstances.
Our information suggests that Flexion Mobile Plc insiders own under 1% of the company. However, it's possible that insiders might have an indirect interest through a more complex structure. It has a market capitalization of just kr485m, and the board has only kr1.4m worth of shares in their own names. Many tend to prefer to see a board with bigger shareholdings. A good next step might be to take a look at this free summary of insider buying and selling.
General Public Ownership
The general public, with a 35% stake in the company, will not easily be ignored. While this size of ownership may not be enough to sway a policy decision in their favour, they can still make a collective impact on company policies.
Private Company Ownership
It seems that Private Companies own 55%, of the FLEXM stock. It might be worth looking deeper into this. If related parties, such as insiders, have an interest in one of these private companies, that should be disclosed in the annual report. Private companies may also have a strategic interest in the company.
Next Steps:
It's always worth thinking about the different groups who own shares in a company. But to understand Flexion Mobile better, we need to consider many other factors.
I like to dive deeper into how a company has performed in the past. You can find historic revenue and earnings in this detailed graph.
If you are like me, you may want to think about whether this company will grow or shrink. Luckily, you can check this free report showing analyst forecasts for its future.
NB: Figures in this article are calculated using data from the last twelve months, which refer to the 12-month period ending on the last date of the month the financial statement is dated. This may not be consistent with full year annual report figures.
We aim to bring you long-term focused research analysis driven by fundamental data. Note that our analysis may not factor in the latest price-sensitive company announcements or qualitative material.
If you spot an error that warrants correction, please contact the editor at editorial-team@simplywallst.com. This article by Simply Wall St is general in nature. It does not constitute a recommendation to buy or sell any stock, and does not take account of your objectives, or your financial situation. Simply Wall St has no position in the stocks mentioned. Thank you for reading.

