Could The Market Be Wrong About Billington Holdings Plc (LON:BILN) Given Its Attractive Financial Prospects?

Billington Holdings (LON:BILN) has had a rough three months with its share price down 28%. However, a closer look at its sound financials might cause you to think again. Given that fundamentals usually drive long-term market outcomes, the company is worth looking at. Specifically, we decided to study Billington Holdings' ROE in this article.
Return on equity or ROE is an important factor to be considered by a shareholder because it tells them how effectively their capital is being reinvested. In other words, it is a profitability ratio which measures the rate of return on the capital provided by the company's shareholders.
Check out our latest analysis for Billington Holdings
How Do You Calculate Return On Equity?
The formula for return on equity is:
Return on Equity = Net Profit (from continuing operations) ÷ Shareholders' Equity
So, based on the above formula, the ROE for Billington Holdings is:
17% = UK£4.8m ÷ UK£28m (Based on the trailing twelve months to December 2019).
The 'return' is the amount earned after tax over the last twelve months. So, this means that for every £1 of its shareholder's investments, the company generates a profit of £0.17.
What Is The Relationship Between ROE And Earnings Growth?
Thus far, we have learnt that ROE measures how efficiently a company is generating its profits. Based on how much of its profits the company chooses to reinvest or "retain", we are then able to evaluate a company's future ability to generate profits. Generally speaking, other things being equal, firms with a high return on equity and profit retention, have a higher growth rate than firms that don’t share these attributes.
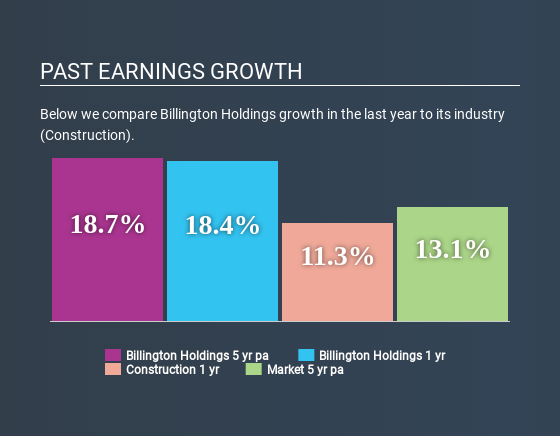
Billington Holdings' Earnings Growth And 17% ROE
At first glance, Billington Holdings seems to have a decent ROE. Further, the company's ROE is similar to the industry average of 17%. This probably goes some way in explaining Billington Holdings' moderate 19% growth over the past five years amongst other factors.
We then compared Billington Holdings' net income growth with the industry and found that the company's growth figure is lower than the average industry growth rate of 24% in the same period, which is a bit concerning.
Earnings growth is a huge factor in stock valuation. What investors need to determine next is if the expected earnings growth, or the lack of it, is already built into the share price. By doing so, they will have an idea if the stock is headed into clear blue waters or if swampy waters await. One good indicator of expected earnings growth is the P/E ratio which determines the price the market is willing to pay for a stock based on its earnings prospects. So, you may want to check if Billington Holdings is trading on a high P/E or a low P/E, relative to its industry.
Is Billington Holdings Efficiently Re-investing Its Profits?
Billington Holdings has a three-year median payout ratio of 34%, which implies that it retains the remaining 66% of its profits. This suggests that its dividend is well covered, and given the decent growth seen by the company, it looks like management is reinvesting its earnings efficiently.
Summary
Overall, we are quite pleased with Billington Holdings' performance. Specifically, we like that the company is reinvesting a huge chunk of its profits at a high rate of return. This of course has caused the company to see a good amount of growth in its earnings. If the company continues to grow its earnings the way it has, that could have a positive impact on its share price given how earnings per share influence long-term share prices. Remember, the price of a stock is also dependent on the perceived risk. Therefore investors must keep themselves informed about the risks involved before investing in any company. You can see the 2 risks we have identified for Billington Holdings by visiting our risks dashboard for free on our platform here.
Love or hate this article? Concerned about the content? Get in touch with us directly. Alternatively, email editorial-team@simplywallst.com.
This article by Simply Wall St is general in nature. It does not constitute a recommendation to buy or sell any stock, and does not take account of your objectives, or your financial situation. We aim to bring you long-term focused analysis driven by fundamental data. Note that our analysis may not factor in the latest price-sensitive company announcements or qualitative material. Simply Wall St has no position in any stocks mentioned. Thank you for reading.
