Could Multi Commodity Exchange of India Limited's (NSE:MCX) Investor Composition Influence The Stock Price?

Want to participate in a short research study? Help shape the future of investing tools and you could win a $250 gift card!
If you want to know who really controls Multi Commodity Exchange of India Limited (NSE:MCX), then you'll have to look at the makeup of its share registry. Generally speaking, as a company grows, institutions will increase their ownership. Conversely, insiders often decrease their ownership over time. Companies that have been privatized tend to have low insider ownership.
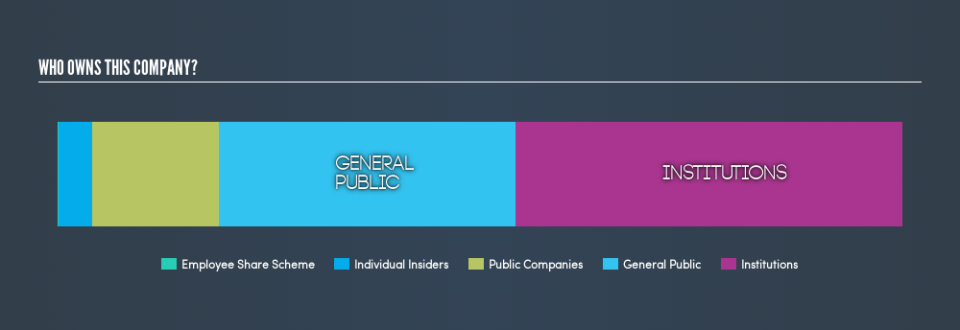
Multi Commodity Exchange of India is not a large company by global standards. It has a market capitalization of ₹40b, which means it wouldn't have the attention of many institutional investors. Taking a look at our data on the ownership groups (below), it's seems that institutions own shares in the company. Let's delve deeper into each type of owner, to discover more about MCX.
See our latest analysis for Multi Commodity Exchange of India
What Does The Institutional Ownership Tell Us About Multi Commodity Exchange of India?
Many institutions measure their performance against an index that approximates the local market. So they usually pay more attention to companies that are included in major indices.
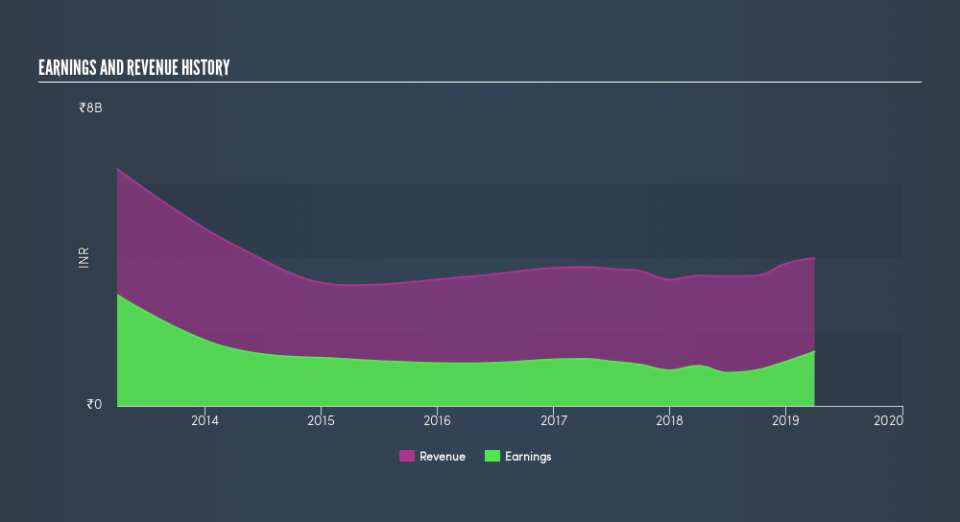
We can see that Multi Commodity Exchange of India does have institutional investors; and they hold 46% of the stock. This can indicate that the company has a certain degree of credibility in the investment community. However, it is best to be wary of relying on the supposed validation that comes with institutional investors. They too, get it wrong sometimes. It is not uncommon to see a big share price drop if two large institutional investors try to sell out of a stock at the same time. So it is worth checking the past earnings trajectory of Multi Commodity Exchange of India, (below). Of course, keep in mind that there are other factors to consider, too.
Hedge funds don't have many shares in Multi Commodity Exchange of India. There are a reasonable number of analysts covering the stock, so it might be useful to find out their aggregate view on the future.
Insider Ownership Of Multi Commodity Exchange of India
The definition of company insiders can be subjective, and does vary between jurisdictions. Our data reflects individual insiders, capturing board members at the very least. The company management answer to the board; and the latter should represent the interests of shareholders. Notably, sometimes top-level managers are on the board, themselves.
I generally consider insider ownership to be a good thing. However, on some occasions it makes it more difficult for other shareholders to hold the board accountable for decisions.
We can see that insiders own shares in Multi Commodity Exchange of India Limited. In their own names, insiders own ₹1.6b worth of stock in the ₹40b company. This shows at least some alignment. You can click here to see if those insiders have been buying or selling.
General Public Ownership
With a 35% ownership, the general public have some degree of sway over MCX. While this group can't necessarily call the shots, it can certainly have a real influence on how the company is run.
Public Company Ownership
It appears to us that public companies own 15% of MCX. It's hard to say for sure, but this suggests they have entwined business interests. This might be a strategic stake, so it's worth watching this space for changes in ownership.
Next Steps:
While it is well worth considering the different groups that own a company, there are other factors that are even more important.
I like to dive deeper into how a company has performed in the past. You can access this interactive graph of past earnings, revenue and cash flow, for free .
Ultimately the future is most important. You can access this free report on analyst forecasts for the company.
NB: Figures in this article are calculated using data from the last twelve months, which refer to the 12-month period ending on the last date of the month the financial statement is dated. This may not be consistent with full year annual report figures.
We aim to bring you long-term focused research analysis driven by fundamental data. Note that our analysis may not factor in the latest price-sensitive company announcements or qualitative material.
If you spot an error that warrants correction, please contact the editor at editorial-team@simplywallst.com. This article by Simply Wall St is general in nature. It does not constitute a recommendation to buy or sell any stock, and does not take account of your objectives, or your financial situation. Simply Wall St has no position in the stocks mentioned. Thank you for reading.

