Could NewLink Genetics Corporation's (NASDAQ:NLNK) Investor Composition Influence The Stock Price?

Every investor in NewLink Genetics Corporation (NASDAQ:NLNK) should be aware of the most powerful shareholder groups. Insiders often own a large chunk of younger, smaller, companies while huge companies tend to have institutions as shareholders. We also tend to see lower insider ownership in companies that were previously publicly owned.
With a market capitalization of US$65m, NewLink Genetics is a small cap stock, so it might not be well known by many institutional investors. Our analysis of the ownership of the company, below, shows that institutions are noticeable on the share registry. Let's take a closer look to see what the different types of shareholder can tell us about NLNK.
View our latest analysis for NewLink Genetics
What Does The Institutional Ownership Tell Us About NewLink Genetics?
Many institutions measure their performance against an index that approximates the local market. So they usually pay more attention to companies that are included in major indices.
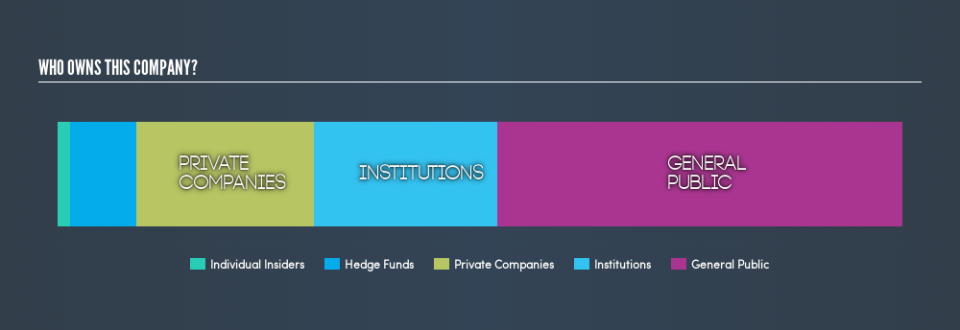
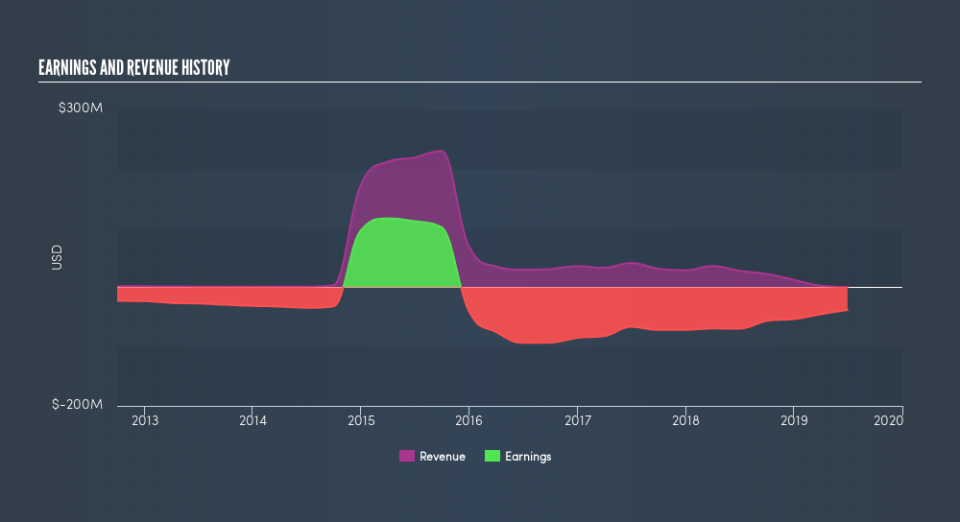
As you can see, institutional investors own 22% of NewLink Genetics. This implies the analysts working for those institutions have looked at the stock and they like it. But just like anyone else, they could be wrong. When multiple institutions own a stock, there's always a risk that they are in a 'crowded trade'. When such a trade goes wrong, multiple parties may compete to sell stock fast. This risk is higher in a company without a history of growth. You can see NewLink Genetics's historic earnings and revenue, below, but keep in mind there's always more to the story.
It looks like hedge funds own 7.8% of NewLink Genetics shares. That catches my attention because hedge funds sometimes try to influence management, or bring about changes that will create near term value for shareholders. There is some analyst coverage of the stock, but it could still become more well known, with time.
Insider Ownership Of NewLink Genetics
The definition of an insider can differ slightly between different countries, but members of the board of directors always count. Management ultimately answers to the board. However, it is not uncommon for managers to be executive board members, especially if they are a founder or the CEO.
Most consider insider ownership a positive because it can indicate the board is well aligned with other shareholders. However, on some occasions too much power is concentrated within this group.
We can see that insiders own shares in NewLink Genetics Corporation. In their own names, insiders own US$1.0m worth of stock in the US$65m company. Some would say this shows alignment of interests between shareholders and the board, though I generally prefer to see bigger insider holdings. But it might be worth checking if those insiders have been selling.
General Public Ownership
The general public, with a 48% stake in the company, will not easily be ignored. While this group can't necessarily call the shots, it can certainly have a real influence on how the company is run.
Private Company Ownership
Our data indicates that Private Companies hold 21%, of the company's shares. It's hard to draw any conclusions from this fact alone, so its worth looking into who owns those private companies. Sometimes insiders or other related parties have an interest in shares in a public company through a separate private company.
Next Steps:
It's always worth thinking about the different groups who own shares in a company. But to understand NewLink Genetics better, we need to consider many other factors.
Many find it useful to take an in depth look at how a company has performed in the past. You can access this detailed graph of past earnings, revenue and cash flow .
If you are like me, you may want to think about whether this company will grow or shrink. Luckily, you can check this free report showing analyst forecasts for its future.
NB: Figures in this article are calculated using data from the last twelve months, which refer to the 12-month period ending on the last date of the month the financial statement is dated. This may not be consistent with full year annual report figures.
We aim to bring you long-term focused research analysis driven by fundamental data. Note that our analysis may not factor in the latest price-sensitive company announcements or qualitative material.
If you spot an error that warrants correction, please contact the editor at editorial-team@simplywallst.com. This article by Simply Wall St is general in nature. It does not constitute a recommendation to buy or sell any stock, and does not take account of your objectives, or your financial situation. Simply Wall St has no position in the stocks mentioned. Thank you for reading.

