Could The Sterling Group Holdings Limited (HKG:1825) Ownership Structure Tell Us Something Useful?

Every investor in Sterling Group Holdings Limited (HKG:1825) should be aware of the most powerful shareholder groups. Generally speaking, as a company grows, institutions will increase their ownership. Conversely, insiders often decrease their ownership over time. Warren Buffett said that he likes ‘a business with enduring competitive advantages that is run by able and owner-oriented people’. So it’s nice to see some insider ownership, because it may suggest that management is owner-oriented.
With a market capitalization of HK$170m, Sterling Group Holdings is a small cap stock, so it might not be well known by many institutional investors. In the chart below below, we can see that institutions don’t own shares in the company. Let’s delve deeper into each type of owner, to discover more about 1825.
See our latest analysis for Sterling Group Holdings
Want to help shape the future of investing tools and platforms? Take the survey and be part of one of the most advanced studies of stock market investors to date.
What Does The Lack Of Institutional Ownership Tell Us About Sterling Group Holdings?
We don’t tend to see institutional investors holding stock of companies that are very risky, thinly traded, or very small. Though we do sometimes see large companies without institutions on the register, it’s not particularly common.
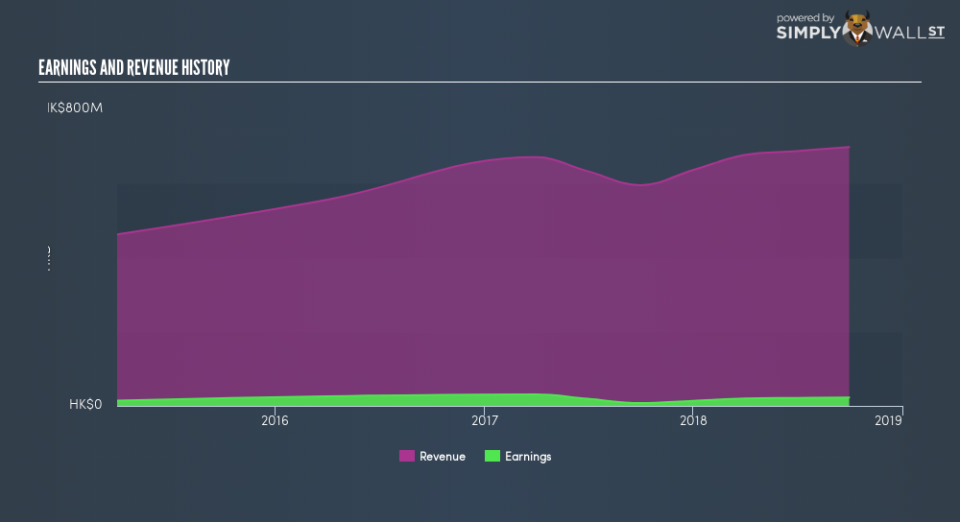
There are multiple explanations for why institutions don’t own a stock. The most common is that the company is too small relative to fund under management, so the institition does not bother to look closely at the company. Alternatively, there might be something about the company that has kept institutional investors away. Sterling Group Holdings’s earnings and revenue track record (below) may not be compelling to institutional investors — or they simply might not have looked at the business closely.
We note that hedge funds don’t have a meaningful investment in Sterling Group Holdings. As far I can tell there isn’t analyst coverage of the company, so it is probably flying under the radar.
Insider Ownership Of Sterling Group Holdings
The definition of company insiders can be subjective, and does vary between jurisdictions. Our data reflects individual insiders, capturing board members at the very least. Management ultimately answers to the board. However, it is not uncommon for managers to be executive board members, especially if they are a founder or the CEO.
Insider ownership is positive when it signals leadership are thinking like the true owners of the company. However, high insider ownership can also give immense power to a small group within the company. This can be negative in some circumstances.
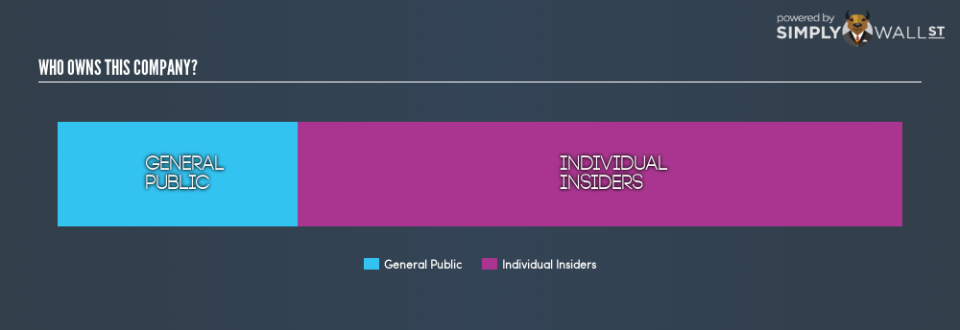
Our most recent data indicates that insiders own the majority of Sterling Group Holdings Limited. This means they can collectively make decisions for the company. Given it has a market cap of HK$170m, that means they have HK$121m worth of shares. Most would argue this is a positive, showing strong alignment with shareholders. You can click here to see if those insiders have been buying or selling.
General Public Ownership
The general public, with a 28% stake in the company, will not easily be ignored. While this size of ownership may not be enough to sway a policy decision in their favour, they can still make a collective impact on company policies.
Next Steps:
While it is well worth considering the different groups that own a company, there are other factors that are even more important.
I always like to check for a history of revenue growth. You can too, by accessing this free chart of historic revenue and earnings in this detailed graph.
If you would prefer check out another company — one with potentially superior financials — then do not miss this free list of interesting companies, backed by strong financial data.
NB: Figures in this article are calculated using data from the last twelve months, which refer to the 12-month period ending on the last date of the month the financial statement is dated. This may not be consistent with full year annual report figures.
To help readers see past the short term volatility of the financial market, we aim to bring you a long-term focused research analysis purely driven by fundamental data. Note that our analysis does not factor in the latest price-sensitive company announcements.
The author is an independent contributor and at the time of publication had no position in the stocks mentioned. For errors that warrant correction please contact the editor at editorial-team@simplywallst.com.
