Could The Zijin Mining Group Company Limited (HKG:2899) Ownership Structure Tell Us Something Useful?

Want to participate in a short research study? Help shape the future of investing tools and you could win a $250 gift card!
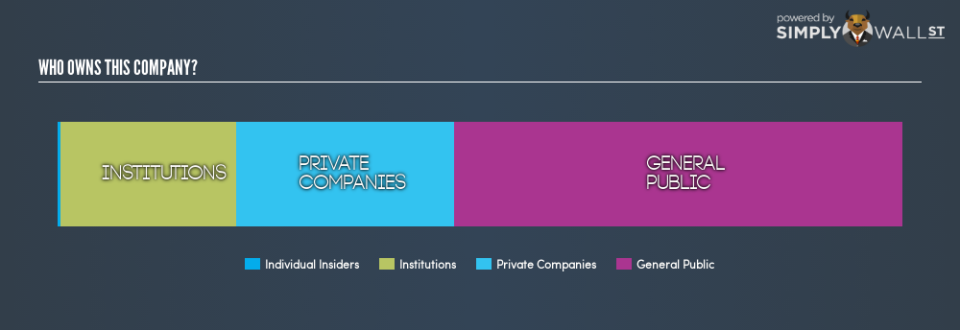
The big shareholder groups in Zijin Mining Group Company Limited (HKG:2899) have power over the company. Institutions often own shares in more established companies, while it’s not unusual to see insiders own a fair bit of smaller companies. Companies that have been privatized tend to have low insider ownership.
With a market capitalization of HK$93b, Zijin Mining Group is rather large. We’d expect to see institutional investors on the register. Companies of this size are usually well known to retail investors, too. Our analysis of the ownership of the company, below, shows that institutions are noticeable on the share registry. We can zoom in on the different ownership groups, to learn more about 2899.
See our latest analysis for Zijin Mining Group
What Does The Institutional Ownership Tell Us About Zijin Mining Group?
Institutional investors commonly compare their own returns to the returns of a commonly followed index. So they generally do consider buying larger companies that are included in the relevant benchmark index.
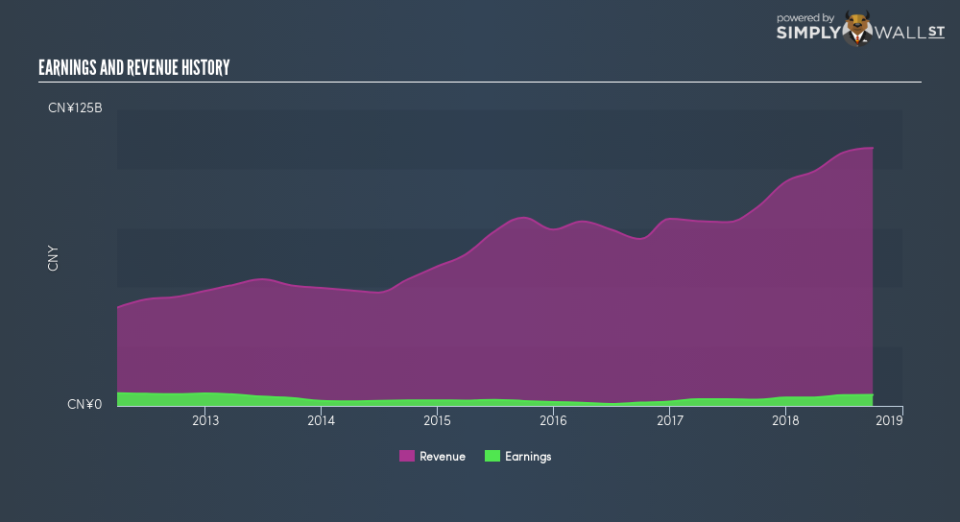
As you can see, institutional investors own 21% of Zijin Mining Group. This can indicate that the company has a certain degree of credibility in the investment community. However, it is best to be wary of relying on the supposed validation that comes with institutional investors. They too, get it wrong sometimes. If multiple institutions change their view on a stock at the same time, you could see the share price drop fast. It’s therefore worth looking at Zijin Mining Group’s earnings history, below. Of course, the future is what really matters.
We note that hedge funds don’t have a meaningful investment in Zijin Mining Group. There are a reasonable number of analysts covering the stock, so it might be useful to find out their aggregate view on the future.
Insider Ownership Of Zijin Mining Group
The definition of company insiders can be subjective, and does vary between jurisdictions. Our data reflects individual insiders, capturing board members at the very least. Company management run the business, but the CEO will answer to the board, even if he or she is a member of it.
I generally consider insider ownership to be a good thing. However, on some occasions it makes it more difficult for other shareholders to hold the board accountable for decisions.
Our data suggests that insiders own under 1% of Zijin Mining Group Company Limited in their own names. But they may have an indirect interest through a corporate structure that we haven’t picked up on. It is a very large company, so it would be surprising to see insiders own a large proportion of the company. Though their holding amount to less than 1%, we can see that board members collectively own HK$427m worth of shares (at current prices). It is good to see board members owning shares, but it might be worth checking if those insiders have been buying.
General Public Ownership
The general public — mostly retail investors — own 53% of Zijin Mining Group . This level of ownership gives retail investors the power to sway key policy decisions such as board composition, executive compensation, and the dividend payout ratio.
Private Company Ownership
We can see that Private Companies own 26%, of the shares on issue. It might be worth looking deeper into this. If related parties, such as insiders, have an interest in one of these private companies, that should be disclosed in the annual report. Private companies may also have a strategic interest in the company.
Next Steps:
While it is well worth considering the different groups that own a company, there are other factors that are even more important.
I always like to check for a history of revenue growth. You can too, by accessing this free chart of historic revenue and earnings in this detailed graph.
If you are like me, you may want to think about whether this company will grow or shrink. Luckily, you can check this free report showing analyst forecasts for its future.
NB: Figures in this article are calculated using data from the last twelve months, which refer to the 12-month period ending on the last date of the month the financial statement is dated. This may not be consistent with full year annual report figures.
To help readers see past the short term volatility of the financial market, we aim to bring you a long-term focused research analysis purely driven by fundamental data. Note that our analysis does not factor in the latest price-sensitive company announcements.
The author is an independent contributor and at the time of publication had no position in the stocks mentioned. For errors that warrant correction please contact the editor at editorial-team@simplywallst.com.
