Do You Like Croma Security Solutions Group plc (LON:CSSG) At This P/E Ratio?

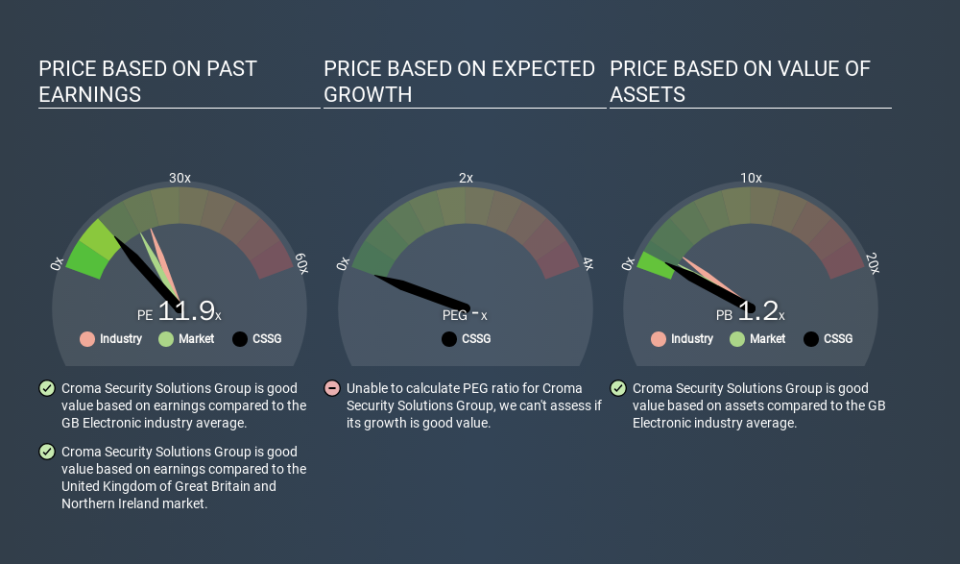
The goal of this article is to teach you how to use price to earnings ratios (P/E ratios). We'll look at Croma Security Solutions Group plc's (LON:CSSG) P/E ratio and reflect on what it tells us about the company's share price. Croma Security Solutions Group has a price to earnings ratio of 11.95, based on the last twelve months. In other words, at today's prices, investors are paying £11.95 for every £1 in prior year profit.
View our latest analysis for Croma Security Solutions Group
How Do I Calculate A Price To Earnings Ratio?
The formula for P/E is:
Price to Earnings Ratio = Price per Share ÷ Earnings per Share (EPS)
Or for Croma Security Solutions Group:
P/E of 11.95 = GBP0.94 ÷ GBP0.08 (Based on the year to June 2019.)
Is A High Price-to-Earnings Ratio Good?
The higher the P/E ratio, the higher the price tag of a business, relative to its trailing earnings. That isn't a good or a bad thing on its own, but a high P/E means that buyers have a higher opinion of the business's prospects, relative to stocks with a lower P/E.
Does Croma Security Solutions Group Have A Relatively High Or Low P/E For Its Industry?
The P/E ratio indicates whether the market has higher or lower expectations of a company. If you look at the image below, you can see Croma Security Solutions Group has a lower P/E than the average (21.8) in the electronic industry classification.
Croma Security Solutions Group's P/E tells us that market participants think it will not fare as well as its peers in the same industry. Many investors like to buy stocks when the market is pessimistic about their prospects. If you consider the stock interesting, further research is recommended. For example, I often monitor director buying and selling.
How Growth Rates Impact P/E Ratios
P/E ratios primarily reflect market expectations around earnings growth rates. Earnings growth means that in the future the 'E' will be higher. Therefore, even if you pay a high multiple of earnings now, that multiple will become lower in the future. And as that P/E ratio drops, the company will look cheap, unless its share price increases.
Croma Security Solutions Group's earnings per share fell by 23% in the last twelve months. But it has grown its earnings per share by 29% per year over the last five years.
A Limitation: P/E Ratios Ignore Debt and Cash In The Bank
It's important to note that the P/E ratio considers the market capitalization, not the enterprise value. Thus, the metric does not reflect cash or debt held by the company. Theoretically, a business can improve its earnings (and produce a lower P/E in the future) by investing in growth. That means taking on debt (or spending its cash).
Such spending might be good or bad, overall, but the key point here is that you need to look at debt to understand the P/E ratio in context.
So What Does Croma Security Solutions Group's Balance Sheet Tell Us?
Croma Security Solutions Group has net cash of UK£1.7m. This is fairly high at 12% of its market capitalization. That might mean balance sheet strength is important to the business, but should also help push the P/E a bit higher than it would otherwise be.
The Verdict On Croma Security Solutions Group's P/E Ratio
Croma Security Solutions Group has a P/E of 11.9. That's below the average in the GB market, which is 18.4. Falling earnings per share are likely to be keeping potential buyers away, but the net cash position means the company has time to improve: if so, the low P/E could be an opportunity.
When the market is wrong about a stock, it gives savvy investors an opportunity. If the reality for a company is not as bad as the P/E ratio indicates, then the share price should increase as the market realizes this. Although we don't have analyst forecasts you could get a better understanding of its growth by checking out this more detailed historical graph of earnings, revenue and cash flow.
But note: Croma Security Solutions Group may not be the best stock to buy. So take a peek at this free list of interesting companies with strong recent earnings growth (and a P/E ratio below 20).
If you spot an error that warrants correction, please contact the editor at editorial-team@simplywallst.com. This article by Simply Wall St is general in nature. It does not constitute a recommendation to buy or sell any stock, and does not take account of your objectives, or your financial situation. Simply Wall St has no position in the stocks mentioned.
We aim to bring you long-term focused research analysis driven by fundamental data. Note that our analysis may not factor in the latest price-sensitive company announcements or qualitative material. Thank you for reading.
