Crude Oil Price Update – Bearish News Could Spike Prices Through $52.46
U.S. West Texas Intermediate crude oil futures tumbled nearly 1% on Monday after comments from a U.S. official dampened hopes that a U.S.-China trade deal would be reached over the short-run, feeding worries that a slowing global economy would reduce global demand growth.
Prices were boosted last Friday after President Donald Trump said he would like to sign phase one of the newly proposed partial trade deal when he meets his Chinese counterpart at November’s APEC summit. However, that move was capped and prices retreated on Monday after the U.S. commerce secretary said an initial trade deal does not need to be finalized next month.
On Monday, December WTI crude oil futures settled at $53.51, down $0.36 or -0.67%.
Daily Swing Chart Technical Analysis
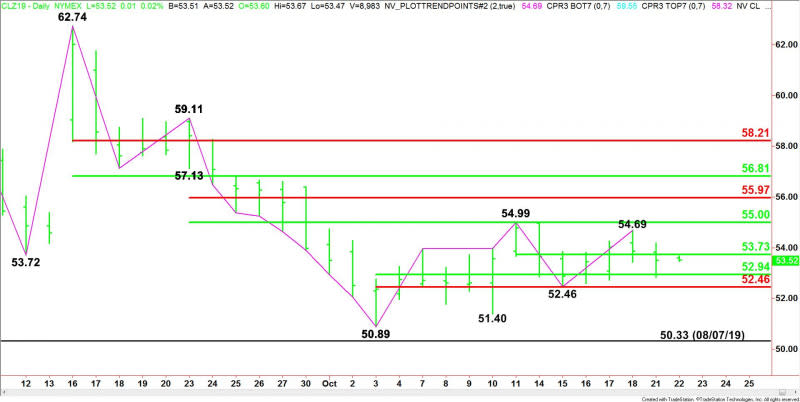
The main trend is down according to the daily swing chart, however, momentum is trending higher. A trade through $54.99 will change the main trend to up. A move through $52.46 will reaffirm the downtrend.
The minor trend is up. This is controlling the momentum. The new minor top is $54.69. A trade through this level will reaffirm the uptrend.
The first short-term range is $50.89 to $54.99. Its retracement zone at $52.94 to $52.46 is action like support. This zone stopped the selling on October 15 at $52.46. On Monday, the top level of this zone was tested successfully.
The second short-term range is $52.46 to $54.69. Its 50% level or pivot at $53.73 is acting like resistance.
The intermediate range is $59.11 to $50.89. Its retracement zone at $55.00 to $55.97 is a potential upside target.
Daily Swing Chart Technical Forecast
Based on Monday’s price action and the close at $53.51, the direction of the December WTI crude oil market on Tuesday is likely to be determined by trader reaction to the 50% level at $53.73.
Bearish Scenario
A sustained move under $53.73 will indicate the presence of sellers. The first potential target is the 50% level at $52.94, followed by the Fibonacci level and main bottom at $52.46.
The support cluster at $52.46 is a potential trigger point for an acceleration to the downside with new targets layered at $51.40, $50.89 and $50.33.
Bullish Scenario
A sustained move over $53.73 will signal the presence of buyers. If this move creates enough upside momentum then look for a potential surge into the minor top at $54.69 and the main top at $54.99.
Side Notes
Government data shows the professionals are short so they’re going to keep defending the trend until overwhelmed by bullish news on the U.S.-China trade talks. Late Tuesday, traders will get the opportunity to react to the American Petroleum Institute’s (API) Weekly Inventories report.
This article was originally posted on FX Empire
