Crude Oil Price Update – Trading Firm as Energy Demand Worries Ease
U.S. West Texas Intermediate crude oil futures are trading higher shortly after the mid-session on Monday amid slightly easing worries over the outlook for energy demand. Rumors that the Group of Seven might put a cap on Russian Crude and worsening supply expectations out of Libya are also bolstering prices.
At 17:43 GMT, August WTI crude oil is trading $109.84, up $2.22 or +2.06%. The United States Oil Fund ETF (USO) is at $82.93, up $1.66 or +2.04%.
In other news, OPEC and its allies, including Russia, are scheduled to meet later this week. However, additional output from OPEC+ is unlikely as the group is expected to stick to the plan announced last month.
Daily Swing Chart Technical Analysis
The main trend is up according to the daily swing chart. However, momentum is trending lower.
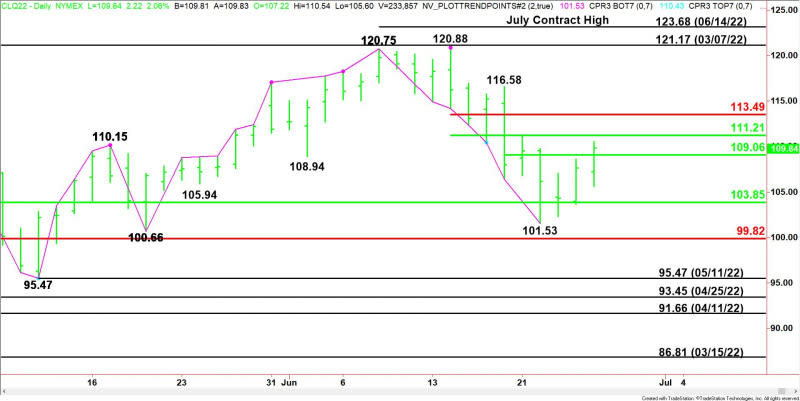
A trade through $100.66 will change the main trend to down. A move through $120.88 will signal a resumption of the uptrend.
The minor trend is down. This is controlling the momentum. A trade through $116.58 will change the minor trend to up.
The main range is $86.81 to $120.88. Its retracement zone at $103.85 to $99.82 is support. This zone stopped the selling at $101.53 on June 22.
The minor range is $116.58 to $101.53. The market is trading on the strong side of its pivot at $109.06, making it support.
The short-term range is $120.88 to $101.53. Its retracement zone at $111.21 to $113.49 is the primary upside target.
Daily Swing Chart Technical Forecast
Trader reaction to $109.06 is likely to determine the direction of the August WTI crude oil market into the close on Monday.
Bullish Scenario
A sustained move over $109.06 will indicate the presence of buyers. If this move creates enough upside momentum then look for the buying to extend into $111.21 to $113.49.
Bearish Scenario
A sustained move under $109.06 will signal the presence of sellers. If this generates enough downside momentum then look for a short-term pullback into the trailing pivot at $106.04. If this fails then look for the move to continue into the main 50% level at $103.85.
For a look at all of today’s economic events, check out our economic calendar.
This article was originally posted on FX Empire
