Crude Oil Price Update – WTI Needs to Hold $63.48 to Sustain Rally
U.S. West Texas Intermediate crude oil futures finished lower last Thursday, while inching higher for the week. The range was tight and volume was light during the holiday shortened week. The news remained supportive, but buyers were scarce. Even though the market hit its highest level since November 5, the buying seemed tentative.
The market continued to be supported by the OPEC-led production cuts and the U.S. sanctions against Venezuela and Iran. An unexpected drop in U.S. crude inventories also underpinned prices. However, concerns have been raised about the continuation of the deal to cut supply beyond its June deadline after Russia hinted it may be considering raising production in an effort to go after U.S. market share.
Last Thursday, June WTI crude oil futures settled at $64.07, up $0.20 or +0.31%.
Daily Swing Chart Technical Analysis
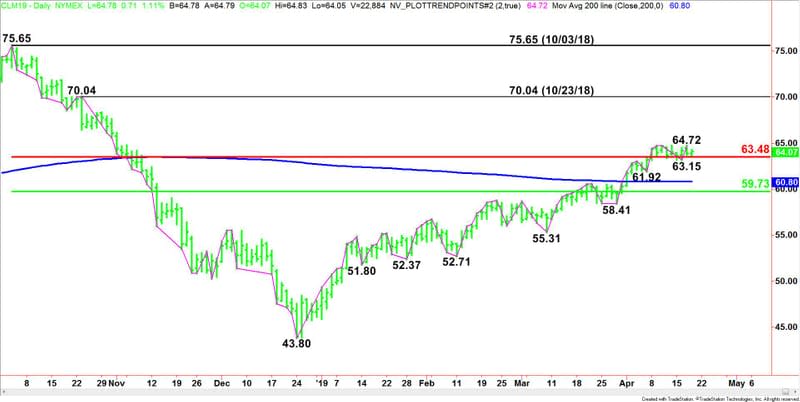
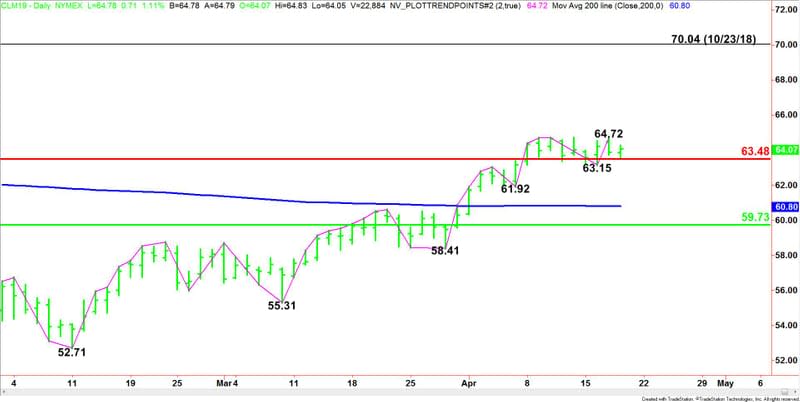
The main trend is up according to the daily swing chart. A trade through $64.72 will signal a resumption of the uptrend. The main trend will change to down on a trade through $63.15.
The main range is $75.65 to $43.80. Its retracement zone at $63.48 to $59.73 is controlling the longer-term direction of the market. The market is currently trading on the strong side of this retracement zone, helping to generate the upside bias.
WTI crude oil is also trading on the strong side of the 200-Day Moving Average at $60.80. This is also supporting the upside bias.
Daily Swing Chart Technical Forecast
Based on last week’s price action, the direction of the June WTI crude oil futures contract on Monday is likely to be determined by trader reaction to the major Fibonacci level at $63.48.
Bullish Scenario
A sustained move over $63.48 will indicate the presence of buyers. If this creates enough upside momentum then look for buyers to take a run at last week’s high at $64.72. Taking out this level will indicate the buying is getting stronger.
The daily chart is wide open to the upside over $64.72. The next major target is the October 23, 2018 main top at $70.04. However, it’s probably going to take some unexpected bullish news to spike prices into this level.
Bearish Scenario
A sustained move under $63.48 will signal the presence of sellers. The first target is the main bottom at $63.15. Taking out this level will change the main trend to down. This could trigger a further break into the next main bottom at $61.92. Taking out this level will reaffirm the downtrend with the 200-Day moving average at $60.80 the next target.
This article was originally posted on FX Empire

