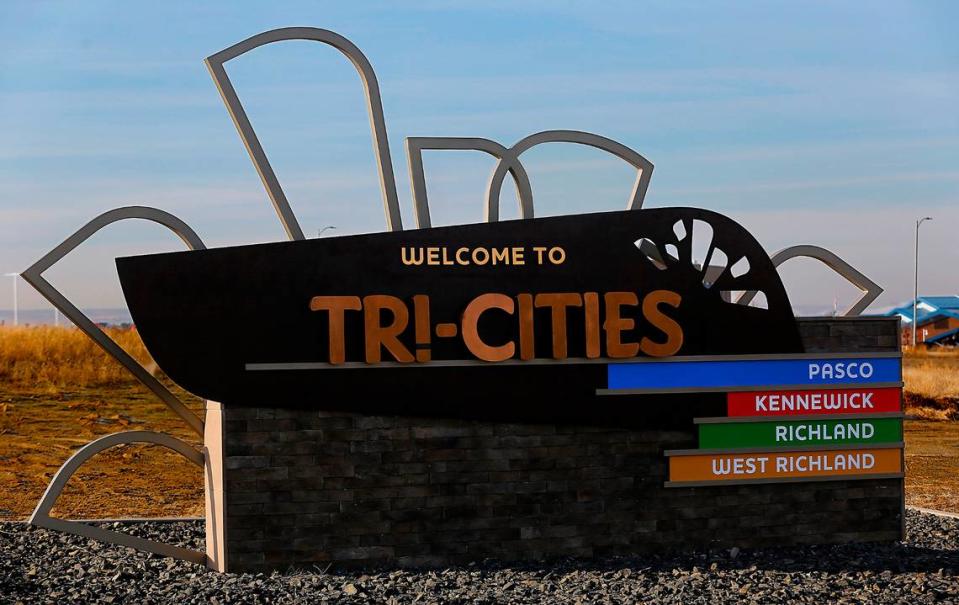
What new data tells us about Tri-Cities - our education, diversity, income and more
The Tri-Cities retains its power to surprise even as the population approaches 320,000.
Despite the rapid growth, the four cities that comprise the Tri-Cities are holding onto their individual identities in some ways and developing new ones in others.
New data released in August indicate our newest neighbors aren’t strangers to the Evergreen State. Most moved to the Tri-Cities from within Benton or Franklin counties or from somewhere else in Washington.
Only a small fraction moved to this area from another state or country.
Kaiya Bliss, a visitor specialist for Visit Tri-Cities, sends relocation packets on request to people interested in moving here.
Bliss estimates half the inquiries come from Washington state, followed by California and Oregon as the other most common sources of requests. Most recently, she’s seen a trend in inquiries coming from the Vancouver, Wash. area.
In the Tri-Cities, old notions about wealth, poverty and ethnicity are giving way to a broader reality.
Income levels in Pasco are comparable to the state average and the city boasts one of the region’s highest home ownership rates, while its larger neighbor, Kennewick, is far below on both counts.
Multigenerational households in Pasco could be driving up household income, speculates Colin Hastings, executive director of the Greater Pasco Area chamber of Commerce. The same could be helping increase home ownership rates and the opportunity for residents to build wealth.
“It’s all growing and pointing in the right direction,” Hastings said.
Richland and West Richland still have the highest incomes across several categories and boast some of the highest education levels.
Only West Richland has an above-average rate of home ownership.
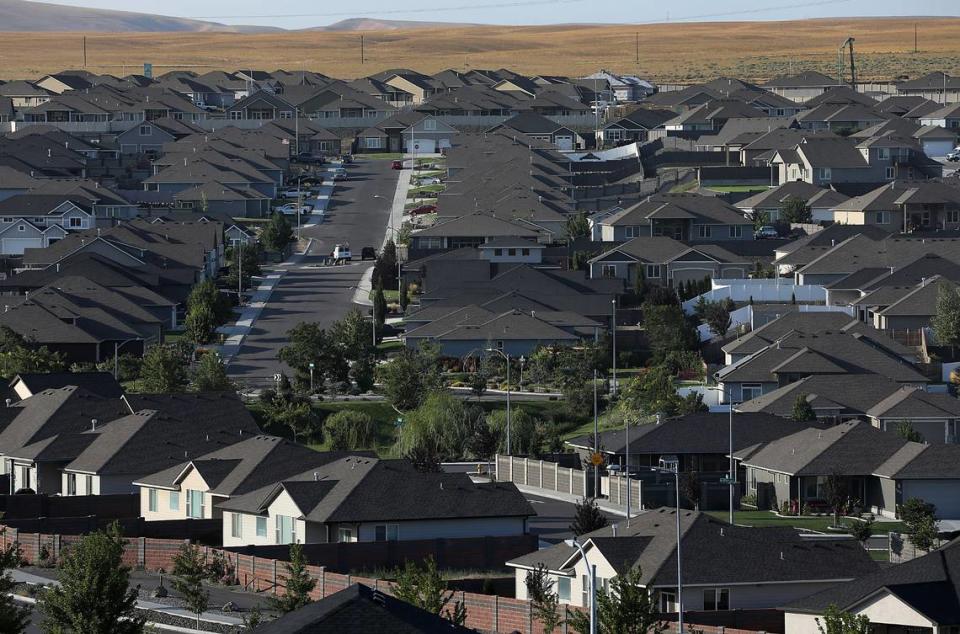
The Tri-Cities added 55,000 residents between 2010 and 2020. That’s a 22% increase that pushed the local population above 300,000 sometime around 2019.
Here’s a snapshot at what the numbers have to tell us about who is living in Kennewick, Pasco, Richland, West Richland, Prosser and Benton City, as told by U.S. Census Bureau.
Figures are based on the 2020 Census as well as the annual American Community Survey. They lag behind the recently released population estimates produced this spring by the Washington Office of Financial Management, which said our population was 316,600 in April.
Kennewick
The largest of the cities, Kennewick has a population of 84,000, and 32,200 houses, apartments and other places people live.
After Pasco, it’s one of the region’s more diverse: White, 65%, Hispanic, 30%, Asian, 3% and Black, 2%
The home ownership rate is 56%. The state average is 64%.
Kennewick residents are generally older than their neighbors, with a median age of 34.
It is in the middle of the pack for the highest level of education achieved by its residents, with 26% holding a bachelor’s degree or higher, and 10% holding graduate degrees or higher.
The state average is 39% for bachelor’s and 16% for graduate degrees.
English is the primary language spoken in 70% of Kennewick homes, followed by Spanish (24%), Indo/European languages (2%) and Asian/Pacific Islander (2%).
Nearly 16% of Kennewick residents were born in another country, about a point above the state average. Of those residents, 36% have become naturalized U.S. citizens. Both figures lag the state average.
A little more than 8% of Kennewick residents moved to the city within the prior year from somewhere else in Benton County. Another 3% moved from somewhere else in Washington and 2% from another state. Fewer than 1% moved from abroad.
The median income was just over $56,000, which is almost $30,000 lower than the state.
Broken down by household types, median family income was $76,200, married couple family income was $93,600 and non-family household income was $39,000.
Pasco
Pasco, with a population of 77,000, has about 24,300 housing units.
It also boasts the region’s third highest home ownership rate: 74.3%, trailing only West Richland and Benton City. That’s well 10 percentage points more than the Washington average.
Census figures affirm that Hispanic residents are a majority, or 57%. English, however, is spoken at home by a narrow margin over Spanish, 50% compared to 46%.
The balance of Pasco’s ethnic and racial makeup is White, 45%, Asian, 2% and Black, 2%.
Nearly one in five Pasco residents was born in another country, making it the area’s leading destinations for immigrants. About a third are naturalized U.S. citizens, which is below average for the state.
Nearly 18% of residents hold a bachelor’s degree, and 7% hold graduate degrees. Both are below the state average.
Nearly 9% of Pasco residents moved to the city within the prior year but they didn’t travel far. They moved from within Franklin County. Another 5% moved from elsewhere in Washington and 2% came from another state. Fewer than 1% were from abroad.
On the paycheck front, Pasco is on par with the state.
Its overall median household income of $82,500 is just shy of the state average of $84,000. Broken down by household, families earned $76,000, married couple families earned $95,000 and non-family households earned $41,200.
Richland
Richland, with a population of 60,560, has 25,500 dwellings and the highest median age in the region, 36 years. The state median is 38.
It is the best educated community in the Tri-Cities, with 45% of residents age 25 or older holding a bachelor’s degree or higher and 19% holding a graduate or professional degree. Statewide, 39% of residents hold a bachelor’s degree.
It does not lead the state for advanced degrees. About 19% of Richland adults hold an advanced degree. It’s above the state average of 16%, but falls behind tech-savvy Western Washington. More than a third of Redmond residents have advanced degrees..
Richland’s ethnic and racial makeup is white, 77%, Hispanic, 13%, Asian, 5, Black, 2%.
English is the primary language spoken in 87% of Richland homes. Spanish is a distant second at 5%, followed by Indo/European languages (4%), and Asian Pacific Islander (3%).
More than half of the 8% of residents who were born in another country are naturalized U.S. citizens, the highest naturalization rate of the region.
Nearly 9% of Richland residents moved to the city within the prior year from somewhere else in Benton County. Another 3% moved from somewhere else in Washington and 3.5% came from another state. Fewer than 1% moved from abroad.
The median household income of $83,000 is slightly below the state average. Broken down by household, median family income was $108,000, married couple family income was $121,000 and non-family household income was $58,000.
West Richland
West Richland, with a population of 16,300, straddles the line between Kennewick, Richland and Pasco to the east and Prosser and Benton City to the west.
It has 5,800 dwellings and a market-leading home ownership rate: 83%.
It has an older population with a median age of 36. Nearly 40% of its residents hold bachelor’s degrees and 15% hold graduate or higher degrees.
West Richland’s ethnic and racial make up is: White, 80%, Hispanic, 14%, Asian, 2%, Black, 1%.
English is the main language spoken in 87.5% of households, followed by Spanish (10%), Indo/European languages and Asian Pacific languages are spoken in fewer than 2% of households.
Nearly 7% of West Richland residents were born in another country, the lowest rate of the region and less than half the state average. Its naturalization rate was 40%, also below the average.
Like its neighbors, West Richland saw its population swell as people moved from nearby. About 5% of newcomers came from elsewhere in Benton County, 2% from elsewhere in Washington and 2% from out of state. Just 0.1% moved from abroad.
West Richland boasts the area’s highest incomes on all counts.
The overall household median income was $109,000. Broken down by category, median family income was $119,000, married couple family income was $124,000 and non-family household income was $60,000.

Prosser
Prosser, population 6,000, has 2,300 dwellings. Its home ownership rate is 61%, slightly below the state average.
The median age is a youngish 33 years and a quarter of its residents over the age of 25 hold bachelor’s degrees.
Prosser’s ethnic and racial makeup is White, 55% and Hispanic 46%.
English is the language of choice in 66% of Prosser households, followed by Spanish, 32%
Nearly 12% of Prosser residents were born in another country. Of those, 35% are naturalized U.S. citizens.
Prosser income levels are lower than most of their neighbors and the state on all counts.
The median income was $61,000 while the median for families was $64,000. For married couple families it was $93,000 and for non-family households it was $25,000.
Benton City
Benton City, with a population of 3,500 residents, is the smallest of the incorporated communities in Benton County.
It boasts 1,381 dwellings and is second only to West Richland in home ownership, with 80% of residents owning their own homes.
On educational attainment, 9% of residents age 25 or older hold a bachelor’s degree or higher.
Benton City’s ethnic and racial makeup is White, 65% and Hispanic, 34%.
English is the preferred language in 67% of Benton City homes, followed by Spanish (32%), with Indo Euro and Asian Pacific coming in at just 1%.
Benton City has an above average number of residents who were born in other countries: 16%. About 22% are naturalized U.S. citizens.
The median household income was $49,000. For families, it was $58,000, for married couple families it was $74,000 and for non-family households it was $25,000.
For a deeper dive go to Benton-Franklin Trends or the Census Bureau.
Sign Up: Boom Town Tri-Cities
Stay up to date on Tri-Cities growth and development with our weekly business newsletter. Get the latest on restaurant and business openings and closings, plus the region’s top housing and employment news. Click here to sign up. In your inbox every Wednesday.

