Declining Stock and Solid Fundamentals: Is The Market Wrong About Applied Materials, Inc. (NASDAQ:AMAT)?
With its stock down 15% over the past month, it is easy to disregard Applied Materials (NASDAQ:AMAT). But if you pay close attention, you might gather that its strong financials could mean that the stock could potentially see an increase in value in the long-term, given how markets usually reward companies with good financial health. Particularly, we will be paying attention to Applied Materials' ROE today.
Return on Equity or ROE is a test of how effectively a company is growing its value and managing investors’ money. Put another way, it reveals the company's success at turning shareholder investments into profits.
See our latest analysis for Applied Materials
How To Calculate Return On Equity?
The formula for ROE is:
Return on Equity = Net Profit (from continuing operations) ÷ Shareholders' Equity
So, based on the above formula, the ROE for Applied Materials is:
55% = US$6.6b ÷ US$12b (Based on the trailing twelve months to July 2022).
The 'return' is the profit over the last twelve months. That means that for every $1 worth of shareholders' equity, the company generated $0.55 in profit.
What Has ROE Got To Do With Earnings Growth?
So far, we've learned that ROE is a measure of a company's profitability. Based on how much of its profits the company chooses to reinvest or "retain", we are then able to evaluate a company's future ability to generate profits. Generally speaking, other things being equal, firms with a high return on equity and profit retention, have a higher growth rate than firms that don’t share these attributes.
A Side By Side comparison of Applied Materials' Earnings Growth And 55% ROE
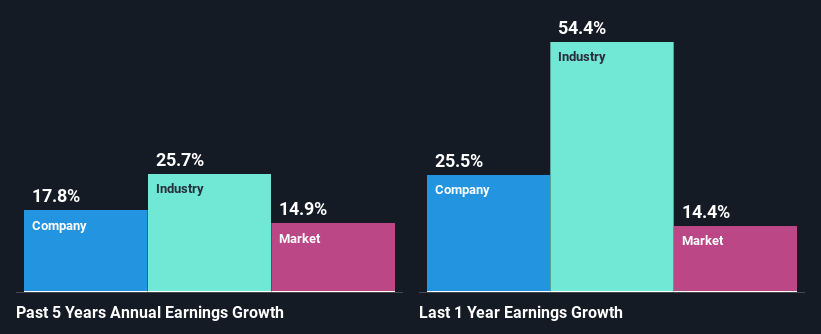
To begin with, Applied Materials has a pretty high ROE which is interesting. Secondly, even when compared to the industry average of 19% the company's ROE is quite impressive. This likely paved the way for the modest 18% net income growth seen by Applied Materials over the past five years. growth
We then compared Applied Materials' net income growth with the industry and found that the company's growth figure is lower than the average industry growth rate of 26% in the same period, which is a bit concerning.
Earnings growth is an important metric to consider when valuing a stock. What investors need to determine next is if the expected earnings growth, or the lack of it, is already built into the share price. This then helps them determine if the stock is placed for a bright or bleak future. Is Applied Materials fairly valued compared to other companies? These 3 valuation measures might help you decide.
Is Applied Materials Efficiently Re-investing Its Profits?
Applied Materials' three-year median payout ratio to shareholders is 20% (implying that it retains 80% of its income), which is on the lower side, so it seems like the management is reinvesting profits heavily to grow its business.
Moreover, Applied Materials is determined to keep sharing its profits with shareholders which we infer from its long history of paying a dividend for at least ten years. Upon studying the latest analysts' consensus data, we found that the company's future payout ratio is expected to drop to 13% over the next three years. Despite the lower expected payout ratio, the company's ROE is not expected to change by much.
Conclusion
On the whole, we feel that Applied Materials' performance has been quite good. Particularly, we like that the company is reinvesting heavily into its business, and at a high rate of return. As a result, the decent growth in its earnings is not surprising. With that said, the latest industry analyst forecasts reveal that the company's earnings growth is expected to slow down. To know more about the latest analysts predictions for the company, check out this visualization of analyst forecasts for the company.
Have feedback on this article? Concerned about the content? Get in touch with us directly. Alternatively, email editorial-team (at) simplywallst.com.
This article by Simply Wall St is general in nature. We provide commentary based on historical data and analyst forecasts only using an unbiased methodology and our articles are not intended to be financial advice. It does not constitute a recommendation to buy or sell any stock, and does not take account of your objectives, or your financial situation. We aim to bring you long-term focused analysis driven by fundamental data. Note that our analysis may not factor in the latest price-sensitive company announcements or qualitative material. Simply Wall St has no position in any stocks mentioned.
Join A Paid User Research Session
You’ll receive a US$30 Amazon Gift card for 1 hour of your time while helping us build better investing tools for the individual investors like yourself. Sign up here

