Should We Be Delighted With Green REIT plc's (ISE:GN1) ROE Of 11%?

Want to participate in a short research study? Help shape the future of investing tools and you could win a $250 gift card!
One of the best investments we can make is in our own knowledge and skill set. With that in mind, this article will work through how we can use Return On Equity (ROE) to better understand a business. By way of learning-by-doing, we'll look at ROE to gain a better understanding of Green REIT plc (ISE:GN1).
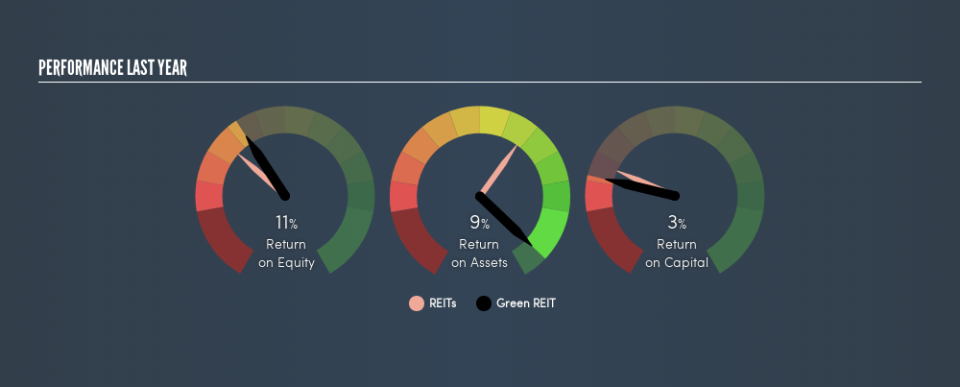
Our data shows Green REIT has a return on equity of 11% for the last year. That means that for every €1 worth of shareholders' equity, it generated €0.11 in profit.
Check out our latest analysis for Green REIT
How Do You Calculate ROE?
The formula for ROE is:
Return on Equity = Net Profit ÷ Shareholders' Equity
Or for Green REIT:
11% = €137m ÷ €1.3b (Based on the trailing twelve months to December 2018.)
Most readers would understand what net profit is, but it’s worth explaining the concept of shareholders’ equity. It is all earnings retained by the company, plus any capital paid in by shareholders. The easiest way to calculate shareholders' equity is to subtract the company's total liabilities from the total assets.
What Does Return On Equity Mean?
ROE looks at the amount a company earns relative to the money it has kept within the business. The 'return' is the amount earned after tax over the last twelve months. A higher profit will lead to a higher ROE. So, all else equal, investors should like a high ROE. Clearly, then, one can use ROE to compare different companies.
Does Green REIT Have A Good ROE?
By comparing a company's ROE with its industry average, we can get a quick measure of how good it is. The limitation of this approach is that some companies are quite different from others, even within the same industry classification. As is clear from the image below, Green REIT has a better ROE than the average (8.3%) in the REITs industry.
That's what I like to see. I usually take a closer look when a company has a better ROE than industry peers. One data point to check is if insiders have bought shares recently.
How Does Debt Impact Return On Equity?
Most companies need money -- from somewhere -- to grow their profits. The cash for investment can come from prior year profits (retained earnings), issuing new shares, or borrowing. In the case of the first and second options, the ROE will reflect this use of cash, for growth. In the latter case, the debt used for growth will improve returns, but won't affect the total equity. Thus the use of debt can improve ROE, albeit along with extra risk in the case of stormy weather, metaphorically speaking.
Combining Green REIT's Debt And Its 11% Return On Equity
Green REIT has a debt to equity ratio of 0.20, which is far from excessive. The fact that it achieved a fairly good ROE with only modest debt suggests the business might be worth putting on your watchlist. Judicious use of debt to improve returns can certainly be a good thing, although it does elevate risk slightly and reduce future optionality.
But It's Just One Metric
Return on equity is a useful indicator of the ability of a business to generate profits and return them to shareholders. Companies that can achieve high returns on equity without too much debt are generally of good quality. If two companies have the same ROE, then I would generally prefer the one with less debt.
Having said that, while ROE is a useful indicator of business quality, you'll have to look at a whole range of factors to determine the right price to buy a stock. It is important to consider other factors, such as future profit growth -- and how much investment is required going forward. So you might want to check this FREE visualization of analyst forecasts for the company.
Of course, you might find a fantastic investment by looking elsewhere. So take a peek at this free list of interesting companies.
We aim to bring you long-term focused research analysis driven by fundamental data. Note that our analysis may not factor in the latest price-sensitive company announcements or qualitative material.
If you spot an error that warrants correction, please contact the editor at editorial-team@simplywallst.com. This article by Simply Wall St is general in nature. It does not constitute a recommendation to buy or sell any stock, and does not take account of your objectives, or your financial situation. Simply Wall St has no position in the stocks mentioned. Thank you for reading.
