Should We Be Delighted With K.P.R. Mill Limited's (NSE:KPRMILL) ROE Of 19%?

One of the best investments we can make is in our own knowledge and skill set. With that in mind, this article will work through how we can use Return On Equity (ROE) to better understand a business. We'll use ROE to examine K.P.R. Mill Limited (NSE:KPRMILL), by way of a worked example.
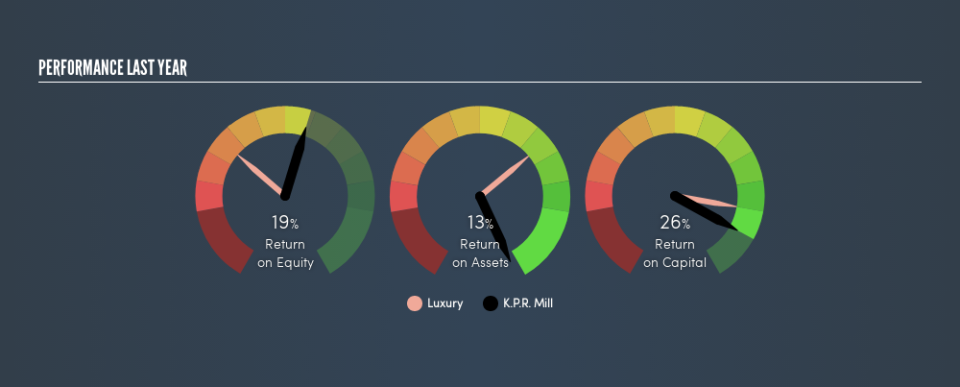
Over the last twelve months K.P.R. Mill has recorded a ROE of 19%. Another way to think of that is that for every ₹1 worth of equity in the company, it was able to earn ₹0.19.
Want to participate in a short research study? Help shape the future of investing tools and you could win a $250 gift card!
See our latest analysis for K.P.R. Mill
How Do I Calculate ROE?
The formula for return on equity is:
Return on Equity = Net Profit ÷ Shareholders' Equity
Or for K.P.R. Mill:
19% = ₹3.3b ÷ ₹18b (Based on the trailing twelve months to March 2019.)
Most know that net profit is the total earnings after all expenses, but the concept of shareholders' equity is a little more complicated. It is all the money paid into the company from shareholders, plus any earnings retained. You can calculate shareholders' equity by subtracting the company's total liabilities from its total assets.
What Does Return On Equity Signify?
Return on Equity measures a company's profitability against the profit it has kept for the business (plus any capital injections). The 'return' is the profit over the last twelve months. The higher the ROE, the more profit the company is making. So, all else being equal, a high ROE is better than a low one. Clearly, then, one can use ROE to compare different companies.
Does K.P.R. Mill Have A Good Return On Equity?
By comparing a company's ROE with its industry average, we can get a quick measure of how good it is. The limitation of this approach is that some companies are quite different from others, even within the same industry classification. As is clear from the image below, K.P.R. Mill has a better ROE than the average (8.1%) in the Luxury industry.
That's clearly a positive. I usually take a closer look when a company has a better ROE than industry peers. One data point to check is if insiders have bought shares recently.
How Does Debt Impact ROE?
Companies usually need to invest money to grow their profits. The cash for investment can come from prior year profits (retained earnings), issuing new shares, or borrowing. In the first two cases, the ROE will capture this use of capital to grow. In the latter case, the use of debt will improve the returns, but will not change the equity. In this manner the use of debt will boost ROE, even though the core economics of the business stay the same.
K.P.R. Mill's Debt And Its 19% ROE
K.P.R. Mill has a debt to equity ratio of 0.46, which is far from excessive. Its very respectable ROE, combined with only modest debt, suggests the business is in good shape. Careful use of debt to boost returns is often very good for shareholders. However, it could reduce the company's ability to take advantage of future opportunities.
The Bottom Line On ROE
Return on equity is a useful indicator of the ability of a business to generate profits and return them to shareholders. A company that can achieve a high return on equity without debt could be considered a high quality business. If two companies have the same ROE, then I would generally prefer the one with less debt.
But ROE is just one piece of a bigger puzzle, since high quality businesses often trade on high multiples of earnings. Profit growth rates, versus the expectations reflected in the price of the stock, are a particularly important to consider. So you might want to check this FREE visualization of analyst forecasts for the company.
If you would prefer check out another company -- one with potentially superior financials -- then do not miss this free list of interesting companies, that have HIGH return on equity and low debt.
We aim to bring you long-term focused research analysis driven by fundamental data. Note that our analysis may not factor in the latest price-sensitive company announcements or qualitative material.
If you spot an error that warrants correction, please contact the editor at editorial-team@simplywallst.com. This article by Simply Wall St is general in nature. It does not constitute a recommendation to buy or sell any stock, and does not take account of your objectives, or your financial situation. Simply Wall St has no position in the stocks mentioned. Thank you for reading.

