Despite Its High P/E Ratio, Is REM Group (Holdings) Limited (HKG:1750) Still Undervalued?

This article is for investors who would like to improve their understanding of price to earnings ratios (P/E ratios). We'll apply a basic P/E ratio analysis to REM Group (Holdings) Limited's (HKG:1750), to help you decide if the stock is worth further research. REM Group (Holdings) has a price to earnings ratio of 35.88, based on the last twelve months. That is equivalent to an earnings yield of about 2.8%.
Want to participate in a short research study? Help shape the future of investing tools and you could win a $250 gift card!
View our latest analysis for REM Group (Holdings)
How Do I Calculate A Price To Earnings Ratio?
The formula for price to earnings is:
Price to Earnings Ratio = Price per Share ÷ Earnings per Share (EPS)
Or for REM Group (Holdings):
P/E of 35.88 = HK$0.22 ÷ HK$0.0061 (Based on the year to December 2018.)
Is A High Price-to-Earnings Ratio Good?
A higher P/E ratio implies that investors pay a higher price for the earning power of the business. That isn't a good or a bad thing on its own, but a high P/E means that buyers have a higher opinion of the business's prospects, relative to stocks with a lower P/E.
How Growth Rates Impact P/E Ratios
If earnings fall then in the future the 'E' will be lower. That means unless the share price falls, the P/E will increase in a few years. Then, a higher P/E might scare off shareholders, pushing the share price down.
REM Group (Holdings) saw earnings per share decrease by 30% last year. And EPS is down 19% a year, over the last 5 years. This growth rate might warrant a below average P/E ratio.
How Does REM Group (Holdings)'s P/E Ratio Compare To Its Peers?
One good way to get a quick read on what market participants expect of a company is to look at its P/E ratio. You can see in the image below that the average P/E (11.2) for companies in the electrical industry is a lot lower than REM Group (Holdings)'s P/E.
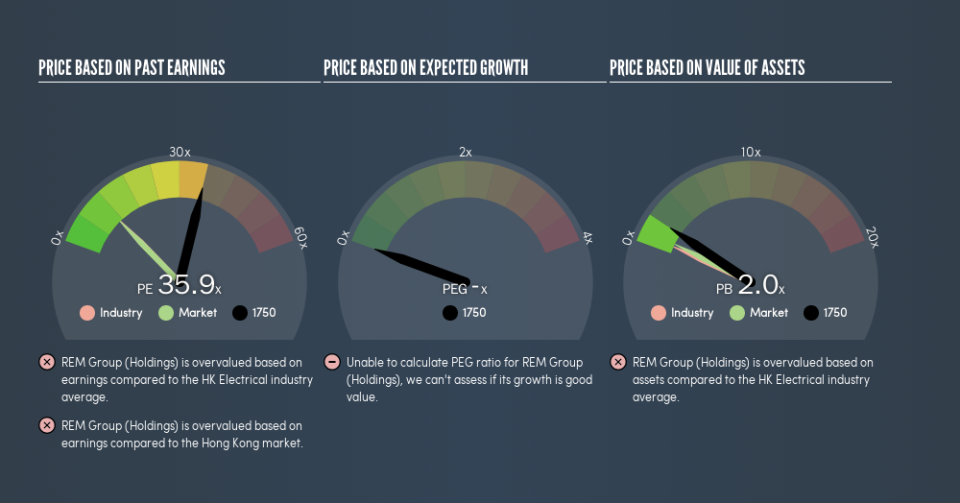
REM Group (Holdings)'s P/E tells us that market participants think the company will perform better than its industry peers, going forward. Shareholders are clearly optimistic, but the future is always uncertain. So investors should delve deeper. I like to check if company insiders have been buying or selling.
A Limitation: P/E Ratios Ignore Debt and Cash In The Bank
The 'Price' in P/E reflects the market capitalization of the company. So it won't reflect the advantage of cash, or disadvantage of debt. In theory, a company can lower its future P/E ratio by using cash or debt to invest in growth.
Such spending might be good or bad, overall, but the key point here is that you need to look at debt to understand the P/E ratio in context.
REM Group (Holdings)'s Balance Sheet
With net cash of HK$99m, REM Group (Holdings) has a very strong balance sheet, which may be important for its business. Having said that, at 25% of its market capitalization the cash hoard would contribute towards a higher P/E ratio.
The Verdict On REM Group (Holdings)'s P/E Ratio
REM Group (Holdings) trades on a P/E ratio of 35.9, which is multiples above the HK market average of 11. The recent drop in earnings per share would make some investors cautious, but the relatively strong balance sheet will allow the company time to invest in growth. Clearly, the high P/E indicates shareholders think it will!
When the market is wrong about a stock, it gives savvy investors an opportunity. If the reality for a company is better than it expects, you can make money by buying and holding for the long term. Although we don't have analyst forecasts, you might want to assess this data-rich visualization of earnings, revenue and cash flow.
Of course, you might find a fantastic investment by looking at a few good candidates. So take a peek at this free list of companies with modest (or no) debt, trading on a P/E below 20.
We aim to bring you long-term focused research analysis driven by fundamental data. Note that our analysis may not factor in the latest price-sensitive company announcements or qualitative material.
If you spot an error that warrants correction, please contact the editor at editorial-team@simplywallst.com. This article by Simply Wall St is general in nature. It does not constitute a recommendation to buy or sell any stock, and does not take account of your objectives, or your financial situation. Simply Wall St has no position in the stocks mentioned. Thank you for reading.
