Despite Its High P/E Ratio, Is Riverine China Holdings Limited (HKG:1417) Still Undervalued?

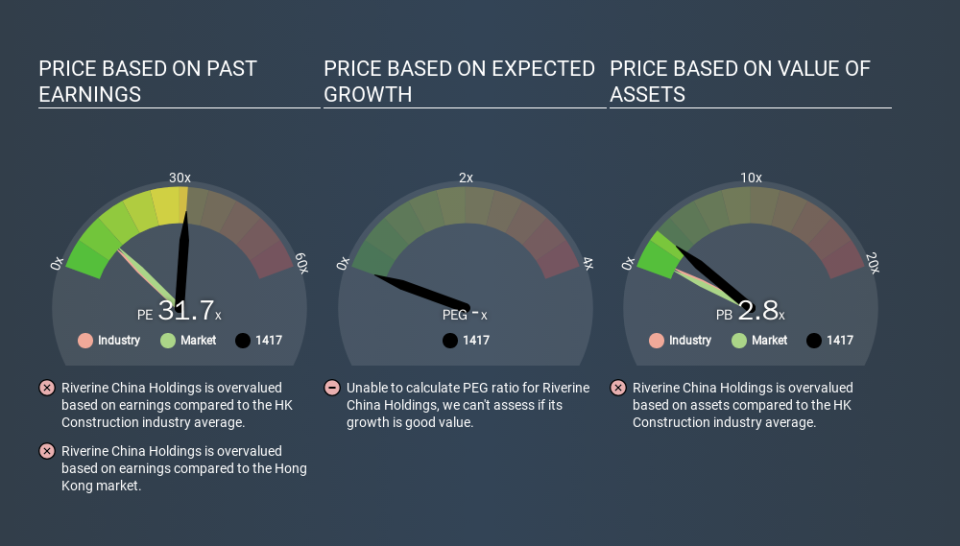
This article is written for those who want to get better at using price to earnings ratios (P/E ratios). We'll apply a basic P/E ratio analysis to Riverine China Holdings Limited's (HKG:1417), to help you decide if the stock is worth further research. Based on the last twelve months, Riverine China Holdings's P/E ratio is 31.73. That is equivalent to an earnings yield of about 3.2%.
View our latest analysis for Riverine China Holdings
How Do You Calculate A P/E Ratio?
The formula for P/E is:
Price to Earnings Ratio = Share Price (in reporting currency) ÷ Earnings per Share (EPS)
Or for Riverine China Holdings:
P/E of 31.73 = CNY1.72 (Note: this is the share price in the reporting currency, namely, CNY ) ÷ CNY0.05 (Based on the trailing twelve months to June 2019.)
Is A High Price-to-Earnings Ratio Good?
A higher P/E ratio implies that investors pay a higher price for the earning power of the business. That isn't a good or a bad thing on its own, but a high P/E means that buyers have a higher opinion of the business's prospects, relative to stocks with a lower P/E.
How Does Riverine China Holdings's P/E Ratio Compare To Its Peers?
The P/E ratio essentially measures market expectations of a company. The image below shows that Riverine China Holdings has a significantly higher P/E than the average (9.9) P/E for companies in the construction industry.
That means that the market expects Riverine China Holdings will outperform other companies in its industry. The market is optimistic about the future, but that doesn't guarantee future growth. So investors should delve deeper. I like to check if company insiders have been buying or selling.
How Growth Rates Impact P/E Ratios
Earnings growth rates have a big influence on P/E ratios. Earnings growth means that in the future the 'E' will be higher. Therefore, even if you pay a high multiple of earnings now, that multiple will become lower in the future. A lower P/E should indicate the stock is cheap relative to others -- and that may attract buyers.
Riverine China Holdings saw earnings per share decrease by 22% last year.
Remember: P/E Ratios Don't Consider The Balance Sheet
One drawback of using a P/E ratio is that it considers market capitalization, but not the balance sheet. Thus, the metric does not reflect cash or debt held by the company. The exact same company would hypothetically deserve a higher P/E ratio if it had a strong balance sheet, than if it had a weak one with lots of debt, because a cashed up company can spend on growth.
Such expenditure might be good or bad, in the long term, but the point here is that the balance sheet is not reflected by this ratio.
So What Does Riverine China Holdings's Balance Sheet Tell Us?
Riverine China Holdings has net cash of CN¥111m. This is fairly high at 16% of its market capitalization. That might mean balance sheet strength is important to the business, but should also help push the P/E a bit higher than it would otherwise be.
The Verdict On Riverine China Holdings's P/E Ratio
Riverine China Holdings has a P/E of 31.7. That's higher than the average in its market, which is 10.6. Falling earnings per share is probably keeping traditional value investors away, but the relatively strong balance sheet will allow the company time to invest in growth. Clearly, the high P/E indicates shareholders think it will!
When the market is wrong about a stock, it gives savvy investors an opportunity. As value investor Benjamin Graham famously said, 'In the short run, the market is a voting machine but in the long run, it is a weighing machine. We don't have analyst forecasts, but you could get a better understanding of its growth by checking out this more detailed historical graph of earnings, revenue and cash flow.
But note: Riverine China Holdings may not be the best stock to buy. So take a peek at this free list of interesting companies with strong recent earnings growth (and a P/E ratio below 20).
If you spot an error that warrants correction, please contact the editor at editorial-team@simplywallst.com. This article by Simply Wall St is general in nature. It does not constitute a recommendation to buy or sell any stock, and does not take account of your objectives, or your financial situation. Simply Wall St has no position in the stocks mentioned.
We aim to bring you long-term focused research analysis driven by fundamental data. Note that our analysis may not factor in the latest price-sensitive company announcements or qualitative material. Thank you for reading.

