Despite Its High P/E Ratio, Is GE Power India Limited (NSE:GEPIL) Still Undervalued?

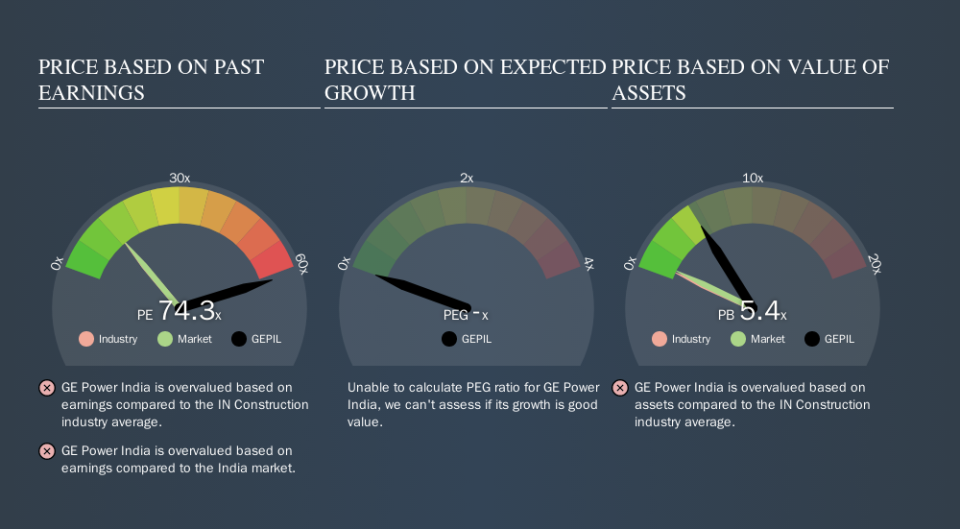
The goal of this article is to teach you how to use price to earnings ratios (P/E ratios). We'll look at GE Power India Limited's (NSE:GEPIL) P/E ratio and reflect on what it tells us about the company's share price. Looking at earnings over the last twelve months, GE Power India has a P/E ratio of 74.30. That means that at current prices, buyers pay ₹74.30 for every ₹1 in trailing yearly profits.
See our latest analysis for GE Power India
How Do I Calculate GE Power India's Price To Earnings Ratio?
The formula for price to earnings is:
Price to Earnings Ratio = Share Price ÷ Earnings per Share (EPS)
Or for GE Power India:
P/E of 74.30 = ₹711.20 ÷ ₹9.57 (Based on the year to June 2019.)
Is A High Price-to-Earnings Ratio Good?
The higher the P/E ratio, the higher the price tag of a business, relative to its trailing earnings. That isn't necessarily good or bad, but a high P/E implies relatively high expectations of what a company can achieve in the future.
Does GE Power India Have A Relatively High Or Low P/E For Its Industry?
The P/E ratio essentially measures market expectations of a company. You can see in the image below that the average P/E (12.9) for companies in the construction industry is a lot lower than GE Power India's P/E.
Its relatively high P/E ratio indicates that GE Power India shareholders think it will perform better than other companies in its industry classification. Clearly the market expects growth, but it isn't guaranteed. So investors should always consider the P/E ratio alongside other factors, such as whether company directors have been buying shares.
How Growth Rates Impact P/E Ratios
Earnings growth rates have a big influence on P/E ratios. If earnings are growing quickly, then the 'E' in the equation will increase faster than it would otherwise. And in that case, the P/E ratio itself will drop rather quickly. And as that P/E ratio drops, the company will look cheap, unless its share price increases.
GE Power India's earnings made like a rocket, taking off 66% last year. Regrettably, the longer term performance is poor, with EPS down 23% per year over 5 years.
Remember: P/E Ratios Don't Consider The Balance Sheet
Don't forget that the P/E ratio considers market capitalization. So it won't reflect the advantage of cash, or disadvantage of debt. Hypothetically, a company could reduce its future P/E ratio by spending its cash (or taking on debt) to achieve higher earnings.
Such expenditure might be good or bad, in the long term, but the point here is that the balance sheet is not reflected by this ratio.
So What Does GE Power India's Balance Sheet Tell Us?
With net cash of ₹8.3b, GE Power India has a very strong balance sheet, which may be important for its business. Having said that, at 17% of its market capitalization the cash hoard would contribute towards a higher P/E ratio.
The Bottom Line On GE Power India's P/E Ratio
With a P/E ratio of 74.3, GE Power India is expected to grow earnings very strongly in the years to come. The excess cash it carries is the gravy on top its fast EPS growth. So based on this analysis we'd expect GE Power India to have a high P/E ratio.
Investors have an opportunity when market expectations about a stock are wrong. As value investor Benjamin Graham famously said, 'In the short run, the market is a voting machine but in the long run, it is a weighing machine. So this free visual report on analyst forecasts could hold the key to an excellent investment decision.
Of course, you might find a fantastic investment by looking at a few good candidates. So take a peek at this free list of companies with modest (or no) debt, trading on a P/E below 20.
We aim to bring you long-term focused research analysis driven by fundamental data. Note that our analysis may not factor in the latest price-sensitive company announcements or qualitative material.
If you spot an error that warrants correction, please contact the editor at editorial-team@simplywallst.com. This article by Simply Wall St is general in nature. It does not constitute a recommendation to buy or sell any stock, and does not take account of your objectives, or your financial situation. Simply Wall St has no position in the stocks mentioned. Thank you for reading.
