Despite Its High P/E Ratio, Is Silverlake Axis Ltd (SGX:5CP) Still Undervalued?

This article is for investors who would like to improve their understanding of price to earnings ratios (P/E ratios). We'll apply a basic P/E ratio analysis to Silverlake Axis Ltd's (SGX:5CP), to help you decide if the stock is worth further research. Based on the last twelve months, Silverlake Axis's P/E ratio is 18.78. That corresponds to an earnings yield of approximately 5.3%.
Want to participate in a short research study? Help shape the future of investing tools and you could win a $250 gift card!
Check out our latest analysis for Silverlake Axis
How Do You Calculate A P/E Ratio?
The formula for price to earnings is:
Price to Earnings Ratio = Price per Share (in the reporting currency) ÷ Earnings per Share (EPS)
Or for Silverlake Axis:
P/E of 18.78 = MYR1.52 (Note: this is the share price in the reporting currency, namely, MYR ) ÷ MYR0.081 (Based on the year to March 2019.)
Is A High P/E Ratio Good?
A higher P/E ratio means that buyers have to pay a higher price for each SGD1 the company has earned over the last year. That is not a good or a bad thing per se, but a high P/E does imply buyers are optimistic about the future.
How Growth Rates Impact P/E Ratios
Companies that shrink earnings per share quickly will rapidly decrease the 'E' in the equation. That means unless the share price falls, the P/E will increase in a few years. Then, a higher P/E might scare off shareholders, pushing the share price down.
Notably, Silverlake Axis grew EPS by a whopping 44% in the last year. In contrast, EPS has decreased by 1.6%, annually, over 5 years.
How Does Silverlake Axis's P/E Ratio Compare To Its Peers?
The P/E ratio essentially measures market expectations of a company. You can see in the image below that the average P/E (15.2) for companies in the software industry is lower than Silverlake Axis's P/E.
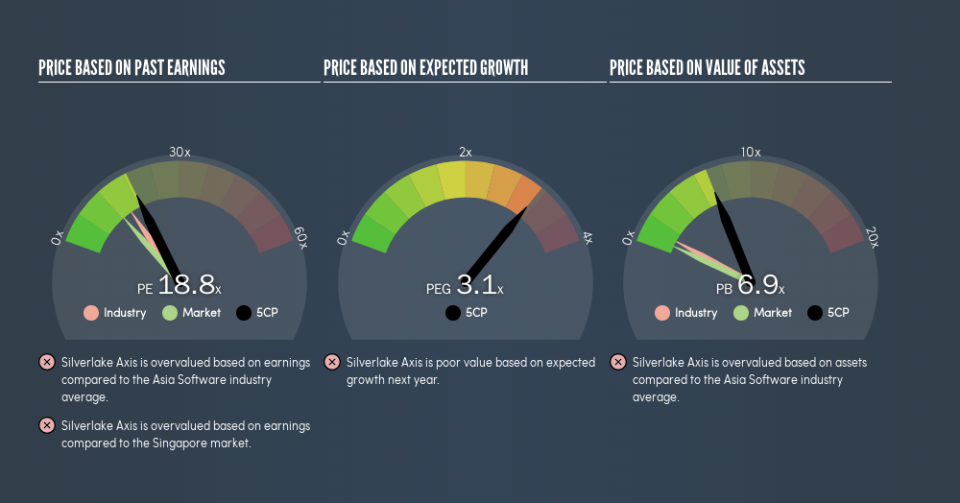
That means that the market expects Silverlake Axis will outperform other companies in its industry. Shareholders are clearly optimistic, but the future is always uncertain. So further research is always essential. I often monitor director buying and selling.
Don't Forget: The P/E Does Not Account For Debt or Bank Deposits
It's important to note that the P/E ratio considers the market capitalization, not the enterprise value. Thus, the metric does not reflect cash or debt held by the company. Hypothetically, a company could reduce its future P/E ratio by spending its cash (or taking on debt) to achieve higher earnings.
Such expenditure might be good or bad, in the long term, but the point here is that the balance sheet is not reflected by this ratio.
So What Does Silverlake Axis's Balance Sheet Tell Us?
With net cash of RM568m, Silverlake Axis has a very strong balance sheet, which may be important for its business. Having said that, at 14% of its market capitalization the cash hoard would contribute towards a higher P/E ratio.
The Verdict On Silverlake Axis's P/E Ratio
Silverlake Axis's P/E is 18.8 which is above average (12.5) in the SG market. Its net cash position is the cherry on top of its superb EPS growth. So based on this analysis we'd expect Silverlake Axis to have a high P/E ratio.
Investors should be looking to buy stocks that the market is wrong about. As value investor Benjamin Graham famously said, 'In the short run, the market is a voting machine but in the long run, it is a weighing machine.' So this free visual report on analyst forecasts could hold the key to an excellent investment decision.
But note: Silverlake Axis may not be the best stock to buy. So take a peek at this free list of interesting companies with strong recent earnings growth (and a P/E ratio below 20).
We aim to bring you long-term focused research analysis driven by fundamental data. Note that our analysis may not factor in the latest price-sensitive company announcements or qualitative material.
If you spot an error that warrants correction, please contact the editor at editorial-team@simplywallst.com. This article by Simply Wall St is general in nature. It does not constitute a recommendation to buy or sell any stock, and does not take account of your objectives, or your financial situation. Simply Wall St has no position in the stocks mentioned. Thank you for reading.
