Despite Its High P/E Ratio, Is Singapore Technologies Engineering Ltd (SGX:S63) Still Undervalued?

Want to participate in a short research study? Help shape the future of investing tools and receive a $20 prize!
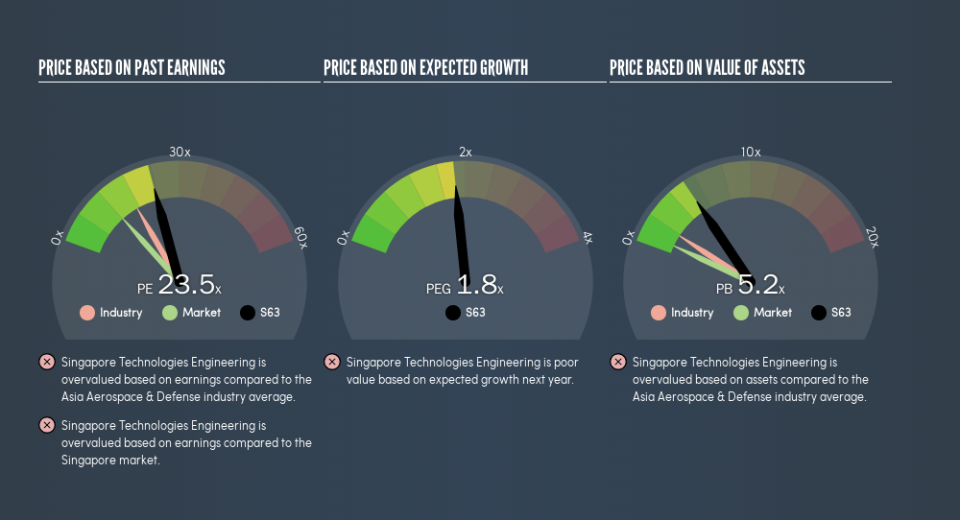
This article is written for those who want to get better at using price to earnings ratios (P/E ratios). We’ll show how you can use Singapore Technologies Engineering Ltd’s (SGX:S63) P/E ratio to inform your assessment of the investment opportunity. Singapore Technologies Engineering has a P/E ratio of 23.54, based on the last twelve months. That means that at current prices, buyers pay SGD23.54 for every SGD1 in trailing yearly profits.
View our latest analysis for Singapore Technologies Engineering
How Do You Calculate Singapore Technologies Engineering’s P/E Ratio?
The formula for price to earnings is:
Price to Earnings Ratio = Share Price ÷ Earnings per Share (EPS)
Or for Singapore Technologies Engineering:
P/E of 23.54 = SGD3.73 ÷ SGD0.16 (Based on the year to December 2018.)
Is A High Price-to-Earnings Ratio Good?
A higher P/E ratio means that buyers have to pay a higher price for each SGD1 the company has earned over the last year. That isn’t necessarily good or bad, but a high P/E implies relatively high expectations of what a company can achieve in the future.
How Growth Rates Impact P/E Ratios
P/E ratios primarily reflect market expectations around earnings growth rates. When earnings grow, the ‘E’ increases, over time. Therefore, even if you pay a high multiple of earnings now, that multiple will become lower in the future. A lower P/E should indicate the stock is cheap relative to others — and that may attract buyers.
Singapore Technologies Engineering’s earnings per share fell by 3.6% in the last twelve months. But over the longer term (3 years), earnings per share have increased by 1.5%. And it has shrunk its earnings per share by 2.4% per year over the last five years. So it would be surprising to see a high P/E.
How Does Singapore Technologies Engineering’s P/E Ratio Compare To Its Peers?
We can get an indication of market expectations by looking at the P/E ratio. You can see in the image below that the average P/E (17.2) for companies in the aerospace & defense industry is lower than Singapore Technologies Engineering’s P/E.
That means that the market expects Singapore Technologies Engineering will outperform other companies in its industry. Clearly the market expects growth, but it isn’t guaranteed. So further research is always essential. I often monitor director buying and selling.
Don’t Forget: The P/E Does Not Account For Debt or Bank Deposits
Don’t forget that the P/E ratio considers market capitalization. That means it doesn’t take debt or cash into account. In theory, a company can lower its future P/E ratio by using cash or debt to invest in growth.
Such spending might be good or bad, overall, but the key point here is that you need to look at debt to understand the P/E ratio in context.
Is Debt Impacting Singapore Technologies Engineering’s P/E?
Net debt totals just 0.7% of Singapore Technologies Engineering’s market cap. It would probably trade on a higher P/E ratio if it had a lot of cash, but I doubt it is having a big impact.
The Bottom Line On Singapore Technologies Engineering’s P/E Ratio
Singapore Technologies Engineering trades on a P/E ratio of 23.5, which is above the SG market average of 12.1. With a bit of debt, but a lack of recent growth, it’s safe to say the market is expecting improved profit performance from the company, in the next few years.
Investors should be looking to buy stocks that the market is wrong about. As value investor Benjamin Graham famously said, ‘In the short run, the market is a voting machine but in the long run, it is a weighing machine.’ So this free report on the analyst consensus forecasts could help you make a master move on this stock.
Of course, you might find a fantastic investment by looking at a few good candidates. So take a peek at this free list of companies with modest (or no) debt, trading on a P/E below 20.
We aim to bring you long-term focused research analysis driven by fundamental data. Note that our analysis may not factor in the latest price-sensitive company announcements or qualitative material.
If you spot an error that warrants correction, please contact the editor at editorial-team@simplywallst.com. This article by Simply Wall St is general in nature. It does not constitute a recommendation to buy or sell any stock, and does not take account of your objectives, or your financial situation. Simply Wall St has no position in the stocks mentioned. Thank you for reading.
