Despite Its High P/E Ratio, Is Peiport Holdings Ltd. (HKG:2885) Still Undervalued?

Want to participate in a short research study? Help shape the future of investing tools and you could win a $250 gift card!
Today, we'll introduce the concept of the P/E ratio for those who are learning about investing. We'll show how you can use Peiport Holdings Ltd.'s (HKG:2885) P/E ratio to inform your assessment of the investment opportunity. Peiport Holdings has a price to earnings ratio of 9.91, based on the last twelve months. In other words, at today's prices, investors are paying HK$9.91 for every HK$1 in prior year profit.
See our latest analysis for Peiport Holdings
How Do You Calculate A P/E Ratio?
The formula for P/E is:
Price to Earnings Ratio = Price per Share ÷ Earnings per Share (EPS)
Or for Peiport Holdings:
P/E of 9.91 = HK$0.38 ÷ HK$0.038 (Based on the year to December 2018.)
Is A High Price-to-Earnings Ratio Good?
The higher the P/E ratio, the higher the price tag of a business, relative to its trailing earnings. All else being equal, it's better to pay a low price -- but as Warren Buffett said, 'It's far better to buy a wonderful company at a fair price than a fair company at a wonderful price.'
Does Peiport Holdings Have A Relatively High Or Low P/E For Its Industry?
The P/E ratio essentially measures market expectations of a company. You can see in the image below that the average P/E (9.9) for companies in the electronic industry is roughly the same as Peiport Holdings's P/E.
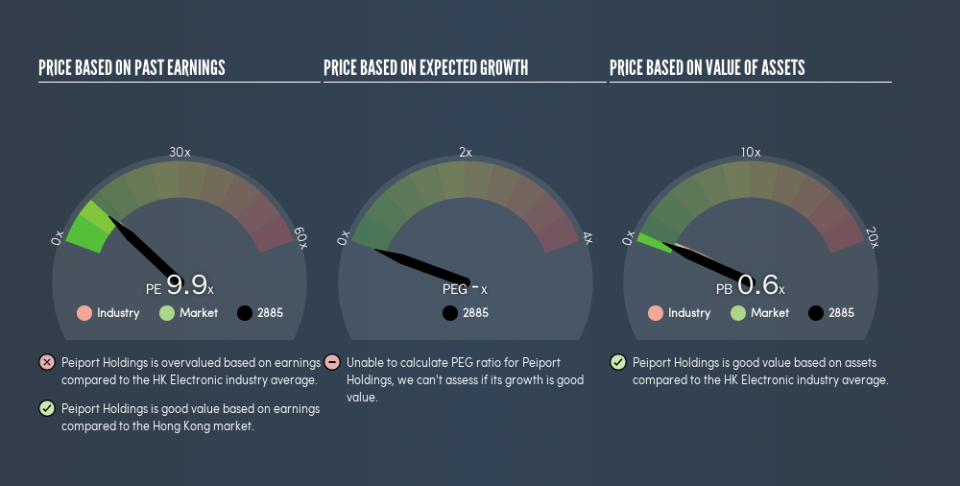
That indicates that the market expects Peiport Holdings will perform roughly in line with other companies in its industry. So if Peiport Holdings actually outperforms its peers going forward, that should be a positive for the share price. I would further inform my view by checking insider buying and selling., among other things.
How Growth Rates Impact P/E Ratios
Earnings growth rates have a big influence on P/E ratios. If earnings are growing quickly, then the 'E' in the equation will increase faster than it would otherwise. Therefore, even if you pay a high multiple of earnings now, that multiple will become lower in the future. A lower P/E should indicate the stock is cheap relative to others -- and that may attract buyers.
Peiport Holdings's earnings per share fell by 67% in the last twelve months.
A Limitation: P/E Ratios Ignore Debt and Cash In The Bank
It's important to note that the P/E ratio considers the market capitalization, not the enterprise value. In other words, it does not consider any debt or cash that the company may have on the balance sheet. Theoretically, a business can improve its earnings (and produce a lower P/E in the future) by investing in growth. That means taking on debt (or spending its cash).
While growth expenditure doesn't always pay off, the point is that it is a good option to have; but one that the P/E ratio ignores.
So What Does Peiport Holdings's Balance Sheet Tell Us?
With net cash of HK$67m, Peiport Holdings has a very strong balance sheet, which may be important for its business. Having said that, at 44% of its market capitalization the cash hoard would contribute towards a higher P/E ratio.
The Bottom Line On Peiport Holdings's P/E Ratio
Peiport Holdings's P/E is 9.9 which is below average (10.7) in the HK market. The recent drop in earnings per share would almost certainly temper expectations, but the net cash position means the company has time to improve: if so, the low P/E could be an opportunity.
Investors have an opportunity when market expectations about a stock are wrong. If it is underestimating a company, investors can make money by buying and holding the shares until the market corrects itself. Although we don't have analyst forecasts, shareholders might want to examine this detailed historical graph of earnings, revenue and cash flow.
Of course, you might find a fantastic investment by looking at a few good candidates. So take a peek at this free list of companies with modest (or no) debt, trading on a P/E below 20.
We aim to bring you long-term focused research analysis driven by fundamental data. Note that our analysis may not factor in the latest price-sensitive company announcements or qualitative material.
If you spot an error that warrants correction, please contact the editor at editorial-team@simplywallst.com. This article by Simply Wall St is general in nature. It does not constitute a recommendation to buy or sell any stock, and does not take account of your objectives, or your financial situation. Simply Wall St has no position in the stocks mentioned. Thank you for reading.

