Despite Its High P/E Ratio, Is S E A Holdings Limited (HKG:251) Still Undervalued?

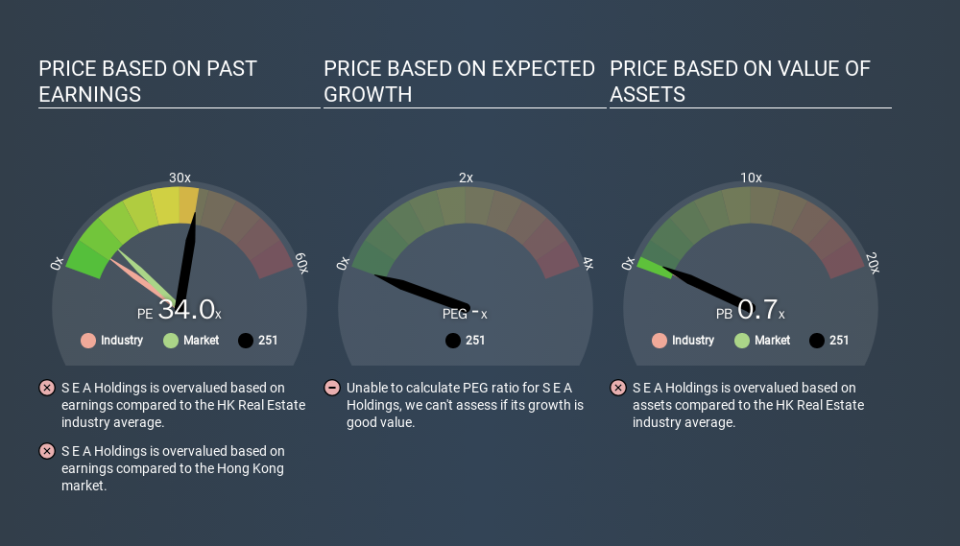
The goal of this article is to teach you how to use price to earnings ratios (P/E ratios). We'll show how you can use S E A Holdings Limited's (HKG:251) P/E ratio to inform your assessment of the investment opportunity. Looking at earnings over the last twelve months, S E A Holdings has a P/E ratio of 33.98. In other words, at today's prices, investors are paying HK$33.98 for every HK$1 in prior year profit.
See our latest analysis for S E A Holdings
How Do I Calculate A Price To Earnings Ratio?
The formula for P/E is:
Price to Earnings Ratio = Price per Share ÷ Earnings per Share (EPS)
Or for S E A Holdings:
P/E of 33.98 = HKD6.80 ÷ HKD0.20 (Based on the trailing twelve months to June 2019.)
Is A High Price-to-Earnings Ratio Good?
A higher P/E ratio means that buyers have to pay a higher price for each HKD1 the company has earned over the last year. That isn't a good or a bad thing on its own, but a high P/E means that buyers have a higher opinion of the business's prospects, relative to stocks with a lower P/E.
How Does S E A Holdings's P/E Ratio Compare To Its Peers?
The P/E ratio essentially measures market expectations of a company. As you can see below, S E A Holdings has a much higher P/E than the average company (6.6) in the real estate industry.
S E A Holdings's P/E tells us that market participants think the company will perform better than its industry peers, going forward. Shareholders are clearly optimistic, but the future is always uncertain. So further research is always essential. I often monitor director buying and selling.
How Growth Rates Impact P/E Ratios
When earnings fall, the 'E' decreases, over time. That means even if the current P/E is low, it will increase over time if the share price stays flat. So while a stock may look cheap based on past earnings, it could be expensive based on future earnings.
It's nice to see that S E A Holdings grew EPS by a stonking 44% in the last year. Unfortunately, earnings per share are down 24% a year, over 5 years.
Don't Forget: The P/E Does Not Account For Debt or Bank Deposits
It's important to note that the P/E ratio considers the market capitalization, not the enterprise value. In other words, it does not consider any debt or cash that the company may have on the balance sheet. The exact same company would hypothetically deserve a higher P/E ratio if it had a strong balance sheet, than if it had a weak one with lots of debt, because a cashed up company can spend on growth.
Such spending might be good or bad, overall, but the key point here is that you need to look at debt to understand the P/E ratio in context.
Is Debt Impacting S E A Holdings's P/E?
S E A Holdings has net debt worth a very significant 132% of its market capitalization. This is a relatively high level of debt, so the stock probably deserves a relatively low P/E ratio. Keep that in mind when comparing it to other companies.
The Verdict On S E A Holdings's P/E Ratio
S E A Holdings's P/E is 34.0 which is way above average (10.1) in its market. Its meaningful level of debt should warrant a lower P/E ratio, but the fast EPS growth is a positive. So despite the debt it is, perhaps, not unreasonable to see a high P/E ratio.
Investors should be looking to buy stocks that the market is wrong about. People often underestimate remarkable growth -- so investors can make money when fast growth is not fully appreciated. We don't have analyst forecasts, but you might want to assess this data-rich visualization of earnings, revenue and cash flow.
But note: S E A Holdings may not be the best stock to buy. So take a peek at this free list of interesting companies with strong recent earnings growth (and a P/E ratio below 20).
If you spot an error that warrants correction, please contact the editor at editorial-team@simplywallst.com. This article by Simply Wall St is general in nature. It does not constitute a recommendation to buy or sell any stock, and does not take account of your objectives, or your financial situation. Simply Wall St has no position in the stocks mentioned.
We aim to bring you long-term focused research analysis driven by fundamental data. Note that our analysis may not factor in the latest price-sensitive company announcements or qualitative material. Thank you for reading.
